There are a number of available tools that can be used to create pictograms as tally charts. Tools such as Interactive-resources' Maths Pack 2 include flash based ITPs that enable class tally charts and pictograms to be made, by dragging or clicking to reveal images. These can be used to support discussion and preparation for students to engage with other data handling processes. IWB Notebooks too can be made, drawing axes using the line tools, then stacks of images created for drag and drop, using the clipart gallery and clone tools to create more personalised pictogram as tally surveys.
The method used to create the pictogram files with Textease, allows a hybridisation of the two process, using the hyperlink tool in the software to create an onclick event. That is to say, to create a file that when spaces within the chart are clicked or pressed, reveal an image or object.
So How do we do this?
The first step in creating a pictogram file is to decide what your survey will be about, and then to collect and import images that will represent and support the data collection process. These images can either be selected from the extensive clip bank provided by the software, or imported from outside the tool.
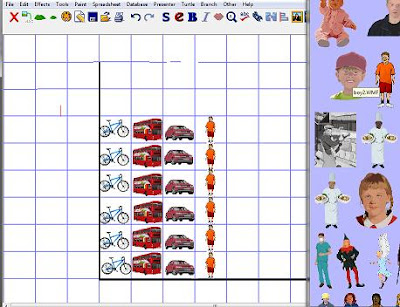
To create my pictogram I began by inserting one of each image I wanted to use, resizing each one to scale to the chart space I was using. With the images in place and resized I selected, then copied them, pasting repeatedly until I had the number of images I wanted to use in each area of the chart. Next I arranged the images in columns as shown in this image.

Unfotunately at the moment there is no quick way to carry out the following step, which is to create the onclick effect, so each image must have the effect applied individually.
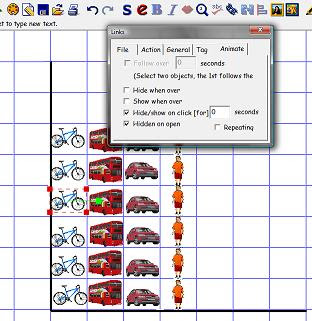
 Adding the Onclick Effect
1) Click to select the image (object) you want to hide and reveal on click.
2) Select the hyperlink button from the tool bar

3) Click the animate tag
4) Click in the "hide/show on click," and "hidden on open" tick boxes
5) Click close
Clicking off the object, the next time it is clicked, it disapears. Clicking on the object again, or rather the space where it should be, reveals it or makes it appear.
Now saving the file and closing it, when opened again it presents the viewer with an empty set of axis, and clicking in the spaces reveals the images hidden there. This tool can now be used with the class to collect data, on our journey to school today as a personalised ITP.
However if your school has a network or site license for the suite of tools, the file can also be shared with students to work on themselves. By placing a copy of the file in a shared folder on the network, students can open softease, and the file to work on themselves; customise it based on their own surveys, perhaps by visiting other classes, or the one developed by the class. They could add personalised titles and axis labels, and "save the file as", to personal spaces to maintain the original template.
As you can see the process of creating the file is fairly straightforward so students could also be helped or shown how to make their own and not ticking or unticking the "hidden on open" box, the survey data can be maintained, for use in other work. The outcomes of activities using this tool can also be saved directly or printed out, without the need to copy the screen to another software environment, which is neccesary when using ITPs such as those mentioned earlier. Providing template files with onclick reveal means this activity would be ideal for use with younger students making pictograms, where the charts can be generated quickly, and the focus of Data Handling activity, that of solving problems and asking and answering questions reache with increased pace. Thanks to Doug and James for sharing this technique with me. I hope the post has done it justice.
2 comments:
Glad you liked the ideas Simon, I have some other prepared examples if you want them. We are in the process of writing lots more 'examples' using the powerful functionalities that Textease has to offer ... watch this space
Thanks Doug, I am always keen to learn, and find applications for techniques I am taught.. I have learned from this experience that I simply haven't given Textease enough time, and would be grateful for the opportunity to play more. Hope you don't mind me giving the secret away.
Post a Comment