I took quite a while formulating a suitably illiterative title for this post, that sets out to share two new podcast episodes. I didn't intend to publish these when I planned the writing unit from which they come, indeed the writing outcome for our work was actually to publish a written anthology, which even as I write is awaiting lamination and binding.
Both podcast episodes were actually recorded in class as integral and incidental parts of our talking for writing process while we experimented and explored rhyme and rhythm during the writing of Limericks and Spells. The poems created by the students were recorded and then played back during literacy hour plenary sessions, inorder to support evaluation of written outcomes against the success criteria we had established for each poetic form. Recording and Listening to the voice recordings was a part of the students ongoing and assessment for learning process, a chance to externalise and share their internal voice, and to consider how or whether their poetry worked within the rules we had established together, as well as an opportunity to consider with their friends how they might improve not only their content but also to gain suggestions about things they might do to restructure parts of the poem before publication. There is for me anyway an incredible sense of satisfaction in these recordings in terms of seeing (sorry hearing) how far the students have moved in their emerging understanding of the relationship between reading and writing for an audience and speaking and listening as a presentational device. They were so keen to include expression and what they were learning that in one case particularly the evidence presented in the limerick shows how the student had so obviously used the spoken cadence and rhythm rehearsed not only during rehearse and write process, but also in his final presentation of his final poem. It is also obvious from the background sound that each poem was recorded in class. The internal mike on my current laptop being sensitive enough to capture not only the performers voice but also the rustlings and tappings of the more "kinaesthetic" members of my class. Fortunatley within the spell recitals these have added to the stormy atmosphere added through the inclusion of thunder claps. I hope you enjoy listening to these, but that also this post in support, offers another perspective on the potential role of digital voice recording and podcasting software in the classroom.
26.2.08
Social Networking: Celebrating the Joy of Learning
After recent TV programmes and negative press surrounding Web 2.0 environments, it was a treat to meet, download and watch this Teachers TV presentation 30 mins well spent, and potentially a great INSET tool to boot! School Matters - Online Social Networks - Friend or Foe?
23.2.08
Goldilocks and the Three Turtles: Sadness Dawns!
 Even though I have been playing with the Probot all week, it never dawned on me to check or measure the size of a Probot Step until this morning. And so needless to say this post probably seems a bit trivial and sad, but do I care... Not a Jot...
This is a bit of a Goldilocks moment, so bear with me.
"A Roamer step was always to large to use when thinking about about standard measuring units (as it needed to be scaled), A LOGO step was too small. But guess what it appears that a Probot Step is just right."
Because...
1 Probot Step = 1 cm
This little nugget/discovery has really excited me because it promises another route into practical and investigational work around shape, space and measure with my ocassionally challenging Numeracy Group.
Goldilocks Image Courtesy of the British Council
Making a Floor Compass With A Probot
Last year when I was working with Y3 we made small hand held cardboard compass models that we could use to help us with our LOGO based map work. This week I am thinking about introducing angle and turn by using the Probot to make floor compasses that students can use with their turtle. This will help introduce and practice using the keypad.
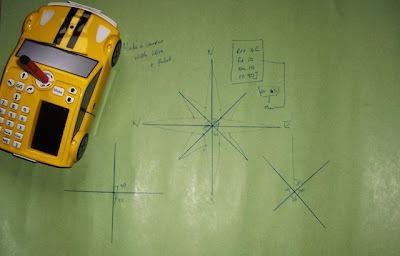 To Make a Compass
Drawing the cardinal points (N,E,S,W)
Place a pen in the pen holder, and the Probot in the centre of a large piece of card, or paper.
input
rpt 4[
fd 20
bk20
rt 90 ]
and press go.
After the Probot finishes, leave it in its end position
Adding The Intercardinal Points (NE, SE, SW, NW)
clear the menu
input rt 45 and press go
clear the menu again then
Input the previous procedure again, but this time substitute 16 for the fd and bk parameters.
ie
repeat 4[
fd 16
bk 16
rt 90 ]
and press go
Turning A Skeleton into a Rose
As a discussion point about the value of the angles between each rotation around the compass I am hoping this will prove invaluable. Eg there are 90 degree turns between each of the cardinal points, 45 degree turns betwen the cardinal and Intercardinal points, while a 90 degree turn or right angle can be made between each Intercardinal Point too. We have explored right angles in numeracy hour, and hopefully the children will recognise these as sketched by the turtle. Using this model the students can mark the turn sizes as well as recording the compass directions. In practical terms I hope the tool will support ongoing work.
I want ultimately the students to design maps and tours using their Probots, and using compass directions to challenge other groups to use their probot in following directions they give. This will later be transferred to onscreen activities using MSW LOGO and imported bitmap treasure maps.
 To Make a Compass
Drawing the cardinal points (N,E,S,W)
Place a pen in the pen holder, and the Probot in the centre of a large piece of card, or paper.
input
rpt 4[
fd 20
bk20
rt 90 ]
and press go.
After the Probot finishes, leave it in its end position
Adding The Intercardinal Points (NE, SE, SW, NW)
clear the menu
input rt 45 and press go
clear the menu again then
Input the previous procedure again, but this time substitute 16 for the fd and bk parameters.
ie
repeat 4[
fd 16
bk 16
rt 90 ]
and press go
Turning A Skeleton into a Rose
- Use a ruler to mark a point 1 cm along each line drawn from the Probot's home position.
- Join each of the cm marks on the Intercardinal directions to the tips of the Cardinal Compass points.
- Join each of the cm marks on the cardinal directions to the tips of the Intercardinal points.
As a discussion point about the value of the angles between each rotation around the compass I am hoping this will prove invaluable. Eg there are 90 degree turns between each of the cardinal points, 45 degree turns betwen the cardinal and Intercardinal points, while a 90 degree turn or right angle can be made between each Intercardinal Point too. We have explored right angles in numeracy hour, and hopefully the children will recognise these as sketched by the turtle. Using this model the students can mark the turn sizes as well as recording the compass directions. In practical terms I hope the tool will support ongoing work.
I want ultimately the students to design maps and tours using their Probots, and using compass directions to challenge other groups to use their probot in following directions they give. This will later be transferred to onscreen activities using MSW LOGO and imported bitmap treasure maps.
22.2.08
Video, Hyperlinking and Quikmaps!
 Having spent a good part of last week playing with Quikmaps, and getting really excited by the possibilities that attaching photographs to place marks provided, I have been pondering on a comment left by Tom, around tagging other media to place marks, and how this might be used with my class. As he suggested, If we can use html tags to embed images from the web to place marks, can we use similar methods to embed other media types, and have them play inside the place mark too? This left me however with additional questions, what if this were not possible, how could we then provide a link to these resources, so they could be used, either as part of a presentation or as part of a data logging or "collect store and share," process. I am concerned that tools such as this do not get used simply because we can, but that the tools we choose to use should match the context of their use and support the generation and development of meaningful and purposeful outcomes. As I began to think my way round this I was also reminded of the E Safety issues we must consider when preparing and developing material for a project such as this. Because of the use of geolocation technologies, we need to ensure that we evaluate material with students to minimise personal reference and risks to identification. These are however considerations that we should all bear in mind as good practice when developing digital content with and for students, as central to their E Safety Education. In preparing digital media work, and reviewing material for publication, we need to bear in mind our school's e safety and digital permissions guidelines.
So this was my starting point. How could and why should I use video with quikmaps? What tools might I use to develop the video in the first place? What purpose might developing this resource or asset have? The notion of asset or resource development is I think a key one in how we view this tool and its role in the teaching and learning process. So where to go!
Contextualising this Asset
Our School is undergoing enormous changes at the moment with the development and construction of a new through campus, of which we will become part. In less than a year the school we now attend will be gone, and the landscape which the students are so familiar changed completely. A great context then for using video assets with students linked to Quikmaps might be to create a living History Archive.
Tools for the job!
I have used MS PhotoStory and Movie Maker a number of times with students at school to present and edit digital work, and with my class early in the year as part of a vodcast experiment. I have been really impressed with how quickly they are able compile and create projects from scratch with this tool, adding sound as a musical background or through direct recording of voiceovers for individual images. In contextualising this idea I am revisiting an idea from an earlier post regarding little patches of ground. As I said above the footprint our school currently leaves in its landscape is about to become a memory or shadow with the development of the new school campus, and its demolition, but this is a place has been a large part of our student's and community's lives for the past 50 years, so how do we preserve the legacy, while moving on?
Using PhotoStory to create a video
Using digital cameras the students might be asked to identify a place or memory from within the school grounds or locality that is special to them, that they would like to preserve or to change, and to capture 2 or 3 images which sum up the essence of their connection to that place, or sum up their reasons for choosing it. Returning to class they would import their images to Photostory, and begin drafting and or rehearsing their script, recording voiceovers to support their "voicethread." On completion the photostory would be exported to video, for upload to a web host.
Uploading Video to the Web
At the moment Quikmaps does not support independently hosted video, and my LA like most does not allow "YouTube" files through the firewall, for the time being anyway, they do seem to allow "Google Video" so for the sake of this project, I will upload my student video clips  to "google video" marking them as unlisted educational files.
Once the videos are uploaded to Google, clicking on the file hyperlink takes me to a page where I can view the video file in its new google video format.
- To the right of this screen is a link button to "email-embed html,"
- Pressing this button offers the chance to get the "embed code" for the video file.
- Click the "embed html" hyperlink to retrieve the code
- Highlight and copy it.
Adding The Video Clip to a Quikmap Place Marker
I need to create my map as outlined in Imaging our Learning Journey and add our place markers. Once this has been done:
- I Click on the pin I wish to associate my video clip with
- Add a heading text or annotation for the clip.
- Copy my "embed code" from Google Video
- Return to my quikmaps window or tab
- Right click in the place mark bubble and paste the embed code
- Repeat this for each pin, and then save the map.
Viewing my Map with Video
Returning to the My Maps page, I can press the view larger image hyperlink, perhaps expanding the view to full screen.
Clicking on the placemarker pins, now not only opens a bubble, but one which contains a "Google Video" player, where I can watch the clip, attached to the context where it was shot, or with which it has an affiliation. (See the image at the beginning of this post)
This "Mashup" can now also be embedded itself into a blog, a website, or maybe even a wiki, by copying and pasting the code given in the "this map in my website" link.
Adding Hyperlinks
In addition to video from Google, embedding images from the web as described here, hyperlinks can also be added to place markers using html. So even if the resource or asset cannot be embedded in the place marker directly, then readers can be redirected to it. Inserting the following piece of code to a place marker where
- Red = the tags embed the hyperlink
- Blue text should be substituted with the web address/url/location of the resource on the web
- Black text should be substituted to create the text in the placemark that describes the place being linked to.
Appologies for the blurriness and pixcelation in this image, will try to fix it later... The tag in place should look something like this.


Linking in this way makes reference to a place on the web, where content you cannot associate directly with the place marker can be found, eg a podcast, a website, or a wiki age/project. If associated with a media file, this would also enable direct download perhaps to the browser, to be saved to the user's computer, or with permission from the user, enable it to be opened in an appropriate application, eg a sound or video file in Media Player. If you wanted to use a file saved to an independent host site then this would be a possible solution to achieving this without using Google.
Born to Ponder
I wonder how many similar contexts for this asset could be conjured up. Some that stand out at the moment are
Recording, logging and tagging a field trip,
Logging experiences on a school journey. A Geoblog!?*
Thinking of Joe Dale and the use of digital media to support MFL, I was wondering whether there might be opportunities to use this tool to support development of MFL assets. Maybe drawing on the student's locality and experiences, to log familiar locations with images and adding/developing commentary in languages as well as English, to develop virtual tour guides, and tools for younger students.
21.2.08
Its A Small Old World...
 An amazing thing happened today, I recieved a comment from Paul Klintworth sharing how he had used ideas from Imaging our Learning Journey to present a journey around his school with a group of children in Vancouver. Visiting their blog today was a fantastic experience. I really liked the way he had adapted the process using colour coded flags to mark the different viewpoints, green to look in towards the school and red to look out onto the landscape surrounding them.
I was reminded on my visit of how, when I first began teaching in Bristol, we used to use photographic trails around historical sites, one that particularly stood out was a trail in the city docks, where students would use photographs to help in an orienteering activity. As I was watching the Photostory made by the students at Paul's school on a visit to Yew Lake, I began thinking again about how interesting it would be to combine media and to use quikmaps as part of a multimodal resource or presentation set, to help students explore and share their viewpoints around their "place in space."
I have been playing over the last couple of days again with Quikmaps, and discovered that video clips uploaded to Google Video can be embedded to play in their player within the place mark bubbles. I have been drawn to the idea of developing a "little patches of ground project" with students for sometime. This afternoon I have been pondering on the possibility of combining the use of photostories with Quikmaps to help develop and embed this idea in a geographical context. Perhaps using MS Photostory to present/create short audio visual clips about places and student thoughts about them, uploading these to the web and then tagging them in quickmaps as student "voice" threads to the locations they relate to.
There are obvious e saftey considerations here, in that places would need to be non specific to particular students personal space in the world, and be impersonal in that they would not feature images of the students themselves. However, in relation to the campus developments at our school currently, it would be an intersting exercise to engage the children in before the landscape they are used to disappears completely. As a Wiki based project this might also be an intersting idea to consider developing with other schools, or maybe other classes within school.
Returning to the small world alluded to in the title, the most amazing thing today was discovering, while seeking permission to share Paul's work, that Bristol, and particularly the area I work is common ground to us both. Albeit a while ago, it seems Paul spent time working with colleagues at my school, as well as teaching in at least one other where I spent time on secondment. Great to hear from you. Thanks to you and your students for sharing your work. Hope to hear again from you soon. :o)
Playing With Probots
 We have been using TTS BeeBots with younger students in school for a while now, but have not until recently had an affordable floor turtle option that we could use with older children to support extension of floorwork and transition to the onscreen LOGO work we want to develop with them. Last Summer I invested in a class set of Probots also from TTS to help us bridge this gap, adding a new layer in the progression of learning in control and modelling with students at school.
The BeeBot has proven a popular and fantastic device to use with young students. I have posted a number of times about how we have used these in the classroom, to play sequencing games, develop prediction and conslidate spatial language. Staff who have used the BeeBot, have begun to find some very creative ways of including the "creatures" in their classroom activities to support learning and sequential thinking particularly across the curriculum, through self developed play mats, based around experiences using TTS's Focus on BeeBot software . The simplicity of the beebot as a device has helped open up and engage my colleagues with the teaching of Control and modelling in the early years and Key Stage 1. This has been supported by work on how with a little creativity and use of other tools this device can enable us to support learning and meet the current early control experiences our students need.
The Beebot's simple keypad enables forward, backward, right and left turns to be input as strings of commands, before using the go button to start the turtle out on the process of carrying out its programmed actions as a procedure. Turns to the left and right are input in multiples of 1/4 turn or 90 degrees. Developing learning within the control and modelling curriculum however is not just about the toole we use, but the pedagogy and thought process behind and which we bring to the activities, and how we use the resources available to contextualise and set problems.
 Enter the Probot, here spotted at what I am told is the most picturesque view in the UK, Wastwater. Shaped like a car this device has a numerical key pad, enabling more complex sequences of commands, to be entered. Its programming language based on LOGO, enables commands to be input as strings as with the BeeBot, but in addition, through use of the onboard menu, procedures can be written and saved, for inclusion in more complex procedures. Rotations are input numerically as well as distances , so the vehicle is able to make turns other than right angles, and does not require repeated input of commands.
Here is a short video clip to show you what I mean.
In the Video I revisited a pattern sequence I created earlier using LOGO.
First of all the Probot was programmed to travel around/trace the perimeter of an imaginary hexagon by inputting
rpt 6[
fd 5
rt 60]
then pressing go
Then a pen was placed in the central pen holder, the placed Probot on a large piece of card and the go button pressed. This lead to the Probot tracing its route on the card and drawing the hexagon I had previously input.
Selecting from the menu to make a new procedure (proc 1), the sequence of commands to draw a hexagon were added, and the procedure saved
now entering
rpt 6[
proc 1
rt 60]
and pressing go
resulted in the probot drawing the hexagon 6 times, with a rotation of 6o degrees in between each hexagon.
The ability to store and run procedures, rather than inputting strings of commands, means that this turtle can be used to mimic on screen activities, and through the use of a usb cable onscreen activity and procedures can be downloaded from the software package Probotix , to the device, enabling onscreen activities to be transferred to the "floor turtle." I have to say that at the moment I am not having as much fun with this software as I thought I might, though this may be just due to my lack of familiarity with its quirks. I will get back to this later I hope, but currently it tends to lock up, when it doesn't recognise code, or when I make mistakes. Perhaps this will be different if I treat it more like the probot, and less like the LOGO environments I am familiar with. This however is a worrying aspect, especially if I want to use this software to support the floor to screen links I want to make.
18.2.08
MSWLOGO: Creating and Decorating Patterns
 Enjoying half term and the chance to just play. A game of Mountain Hockey this morning, a spot of domestication this afternoon, before playing with MSWLOGO and Microsoft Paint this evening.
Having got my substitution procedure for making a polygon working yesterday, at Andy's suggestion I added another attribute to alter polygon side length so the polygon procedure now looks like this...
to polygon :SIDES :LENGTH
REPEAT :SIDES [FD :LENGTH RT 360/:SIDES]
END
I can now change the type of regular polygon I draw and its side lengths too.
What this means is I no longer need to tell LOGO to draw a particular polygon, However I do need to know its properties, in terms of the number of sides and angles I want it to have, and to decide how large I would like it to be, before I can input these for the turtle to do the hard work of drawing it.
I decided to just play with what I had for the time being and to make a pattern using my polygon procedure and a simple repeat routine, inputting several pentagons that gradually increase in side length before turning through 36 degrees.
Experiences, working with y4 students making "flowers" tell me that this is what they tend to do and get excited by when we explore the environment, having compiled and saved their static polygon procedures, and why not its fun and exciting to see what the turtle draws when he has been programmed.
In this instance the procedure I asked the turtle to carry out looked like this
repeat 10 [polygon 5 50 polygon 5 100 polygon 5 150 polygon 5 200 polygon 5 250 rt 36]
 And this was the resultant pattern.
When the turtle had finished and put his feet up, I saved the workspace as a "bitmap image,"
 and then opened it in Microsoft Paint. Again in work I have carried out with students this is a task they love to do. Using the "fill tools" with the Bitmap created in MSWLOGO, students are able to colour the repeating patterns made, and the design you can see at the top of this post was created in this way.
When I set out to create the pattern, I originally set myself the pattern rule, to use only 2 colours, and fill the design so that no 2 shapes in the pattern that touched or were adjacent to each other would be the same colour. However as I moved outward from the centre of the pattern, I reached a point where it was not possible to follow the rule, so I needed to introduce a third colour.
I am really enjoying this free piece of software and looking forward not only to exploring it further, but looking at how the processes I have missed out on by not engaging more deeply with it, can be applied to my play with the Probot I have brought home with me this week. I am also beginning to reflect on how the use of prewritten procedures might facilitate and support investigational work and consolidation activities in Mathematics sessions around the properties of shape and measure, as well as extension and challenge for more able students in ICT sessions as suggested by previous comments by Andy. Thanks
Investigating a Rectangle with LOGO
This week I will mostly be playing with Probots and the Educational freeware environment MSWLOGO I had installed in school a while back. LOGO is an environment I haven't explored in as much depth as I should have, or so I am beginning to discover, particularly with the increased focus within the New Primary Framework for Mathematics on the using and applying strands.
As I have begun to play with these tools this week, exploring beyond the simple repeat and build procedures I initially work through with students, I am beginning to discover just how superficial my personal understanding and capability with the tool is, and just how big a mistake it was on my part not to persist with the environment in my early teaching career. These short sharp sessions are beginning to challenge me to think more deeply about how I could use tools like LOGO more regularly to challenge and support reasoning and thinking with students during the numeracy hour, a place where I have long believed this aspect of Control and modelling within the primary ICT curriculum should be embedded.
Experience tells me there is a tendency for LOGO to be used and taught in the Primary School these days when the QCA Units for ICT that utilise it make that requirement. This leads generally to control sessions being developed through the delivery of standalone units such as this in Y4. What concerns me about this is not children learning to build procedures that make pretty flower designs, but that from a pedagogical perspective there is much more to LOGO as a learning tool than this. By linking the tool to help develop units of work involving application of knowledge and understanding of shape, space and measure. As a "constructivist" learning tool, LOGO affords opportunities to design learning contexts through which to apply, link and develop strategies for problem solving and investigational work while using the environment to model and explore generalisations and hypotheses.
Thinking about Rectangles
While playing today I have been thinking about rectangles and how, when shown an oblong many of my students are able to identify and describe its basic properties, eg. it is a rectangle, it has four sides, four angles or corners, and each angle is a right angle. When we compare the shape with a square that shares these properties, and the students are asked how they differ? discussions usually begin with how one shape is longer than the other. Further questioning and discussion will lead to us identifying how opposite sides of an oblong are the same length, and how the square is a special (regular) rectangle, but making specific reference to the nature of the opposing sides of an oblong is something which is quickly forgotten.
Coding LOGO to draw an oblong requires us to use and apply this property. Even though the shape has 4 sides, a repeat 4 procedure, would not be an efficient way to input the parameters. Writing even a simple repeat procedure, requires us to think slightly differently about the way we should input our commands in order to draw the oblong. So how might I use LOGO to explore and consolidate understanding about the properties of rectangles as members of the quadrilateral family.
Thinking Through an Investigation
In previous sessions, adapting the QCA Unit linked to above while working with students I have tended to stick to developing regular polygons of a standard side length, returning to making Irregular Rectangles or oblongs later, perhaps if or when students have asked how to do this. This leads to a naturalish discussion about the properties of rectangles.
As said above squares can be classified as Regular Rectangles, as such they have 4 equal sides, 4 equal and identical angles, and the same number of lines of symmetry as they do sides and angles. Each angle is a right angle measuring 90 degrees.
A square can be made with a repeat procedure
repeat 4 [fd X rt 90]
Or using the polygon procedure I published previously, by inputting polygon :side :length.
This would not work for an oblong since adjacent sides are different lengths, while opposite sides are equal.
Building a Procedure to Draw Rectangles
Lets say we wanted the turtle to travel around the perimeter of an oblong 300 units long, we could do this by inputting commands that would draw 2 sides of 100 units and 2 sides of 50 units, using a set of commands that look something like this
fd 100 rt 90 fd 50 rt 90 fd 100 rt 90 fd 50 rt 90
To turn this into a repeat procedure, we could rewrite it something like this:
repeat 2 [fd 100 rt 90 fd 50 rt 90]
So a build command would look something like this...
To rectangle
repeat 2 [fd 100 rt 90 fd 50 rt 90]
end
Saving this procedure, typing in rectangle and hitting the enter key would draw a rectangle where 2 sides were 100 units long and 2 sides were 50 units long.
Building a Procedure to Create Variable Rectangles
The last procedure would be fine if we always wanted to make our rectangle the same shape and size, or we were happy to edit our procedure every time we wanted to change the size of our rectangle. But if we wanted to use our program to help us investigate for example the perimeters of rectangular fields that a farmer could fence with 300 metres of wire? Or the different rectangles we could draw with a particular perimeter it would be useful to have a program where we were able to substitute parameters. (Thanks Andy am having lots of fun with this!) In this case we might use a procedure something like this:
to rectangle :sidea :sideb
repeat 2 [fd :sidea rt 90 fd :sideb rt 90]
end
Investigating Rectangles Maybe!
Now I could begin either inputting side lengths to the procedure to randomly draw different rectangles, or I could begin applying my knowledge and experience about the properties of rectangles, using other areas of mathematical experience such as calcualation, addition and subtraction, halving and doubling etc to help me explore/investigate the substitution values that total a given perimeter, using my procedure to model and test my work by inputting my values and testing on screen. Eg with my length of 300 metres or Turtle units
rectangle 40 110 and hitting the enter key would draw on oblong with this perimeter
40+40+110+110= 300
The procedure models the familiar formula for calculating the perimeter of a rectangle
2l+2w=p
(2x40) + (2x110) = 300
What about rectangle 45 105?
45+45+105+105=300
A suitable problem might be for children to investigate some of the different ways of fencing a rectangular field with 300 metres of wire (using 300 turtle units to represent this).
I don't think I would show the children the procedure and how it works. Instead it might be fun to begin with trial and error processes through the introduction and investigation of a systematic pattern, similar to the example below
40+40+110+110= 300 (rectangle 40 110)
45+45+105+105=300 (rectangle 45 105)
50+50+100+100=300 (rectangle 50 100)
What might the next sequence or input be? What can we see happening in the pattern? What would happen to the pattern if we changed 40 to 41 or 42 and so on? The students could use whiteboards to record their patterns, inputs and informal jottings if necessary, with the focus of the task being around paired discussion, mediated by the onscreen feedback and success of their input in relation to the expected output of a rectangle.
Moving on perhaps we could ask the children to use their experiences to visualise, map out and draw what they think the turtle has to do in creating each of the rectangles they have drawn, focusing their attention to the visible properties of each shape and how these relate to the numerical values they have inputted. Notice the line (perimeter) made by the turtle travels around the shape, so each step carried out must have been in sequence. Even though still focussed on the properties of oblongs and the relative location of their sides, we also have the contingency within this activity to begin to introduce the idea that 2 of the values in each of the patterns are the same, and that as the turtle draws them they output to become opposite sides of the oblong and that adjacent sides are of different lengths. So perhaps at this point we could look at or introduce a simple repeat procedure for drawing a rectangle and explore how each value might be substituted into the program, talking through the effect, drawing and visualising it before returning trying it on screen, perhaps with trace enabled, and finally reviewing our square and oblong, discussing how or if what we have learned during our investigation has changed our view of the two shapes. This might also support introduction of the formula for calculating perimeter of squares and other rectangles, by comparing and deriving the standards from the LOGO procedures.
eg repeat 4 [fd x rt 90]
could be reduced to the perimeter of a square is equal to 4 times the length of 1 side
so p=4xl
repeat 2 [fd x rt 90 fd y rt 90]
could be reduced to the perimeter of a rectangle is equal to 2 times the length add 2 times its width.
so p=2l+2w
Using the rectangle procedure again the task could be extended to enable students to test and investigate the shapes of fields that can be fenced using different lengths of wire by the farmer. What length would each side be if the farmer wanted to make a square field using the length of wire he has?
In class and at table tops, this activity could be further extended to explore the relationship between area and perimeter in each shape, using squared paper to explore the different shaped fields the farmer can make, and the area of each one.
This may seem an ambitious proposal, but I would be fascinated to see just what a KS2 class would make of the activity. I think most of us would be surprised to see just what a Y4 class can learn about the properties of polygons and rotation when using the idea that 360 degrees is the same as a full turn, and substituting factors of 360 within repeat procedures to make "flowers" from fixed shape procedures. The potential mathematical outcome of the Y4 unit linked to above, is way more complex than on first viewing the unit expects, yet if students are to appreciate and understand the outcomes of the tasks, beyond the making of flowers and context is to be given to what is being learned we need to engage the children with the mathematical ideas inherent within it. Perhaps this unit can be taken to pieces, and bits and pieces used or built into wider mathematical work. How might changing our view of this unit enable exploration and application of visual models to support reasoning and understanding about shape?
17.2.08
Expanding my Horizons With LOGO
 Thanks to Andy Roberts for his comment a couple of weeks ago on my post Logo Routines: Building Polygons, where he said,
"To differentiate for the top stream it should be possible to teach the concept of parameter substitution so the challenge would be to write a procedure called Polygon which draws one of any number of sides depending on the number passed across. Most class teachers will stop before getting to this stage, which is a shame because for those who 'get it' a whole new world of constructionism opens up.
I have to admit to being one of those class teachers who never got to this stage, so having had a browse around and a bit of a play, here is my first LOGO procedure using parameter substitution routine, is that the right term Andy?!* It is for drawing a polygon of x number of sides as suggested:
To polygon :SIDES
REPEAT :SIDES [FD 100 RT 360/:SIDES]
END
So if I now if I want to draw a hexagon, I can input
polygon 6
The procedure, substitutes sides with the number six, and calculates the turn size, by dividing 360, by the number of sides I want the shape to have.
If I now input
repeat 6 [polygon 6 rt 60]
I can create a pattern like this..
 I guess my next adventure will be to create a "pattern" procedure or write a program that will allow me to substitute not only the :side parameter in the polygon procedure, but also to include a series of turns to output my pattern drawing on the polygon procedure. Mmmm! Looks like I am all set for a bit of a personal engagement to expand my LOGO programming. Will have a crack at this while preparing my unit of work with the Probot for my students. Maybe you can teach an old dog new tricks!!!
Imaging our Learning Journey: Learning to attach images to a Quikmap!
For a while now I have looked in awe at Quikmaps developed by colleagues, where photographs have been associated to placemarks, wondering how this was achieved. I shared my most recent post through twitter and Tom Barrett came to the rescue. I hadn't realised that the use of html tags in the place mark bubbles, would load images stored elsewhere on the web. This has opened a whole new world of possibility for me, and presented yet another tool to use in data logging and monitoring with my students.
In class a couple of weeks back, my Y3 students mapped a "landscape walk" locating images collected by "tagging" them on a table top map. This map used an aerial photograph I had previously made and then screen captured from quickmaps. To capture the map, for use in the classroom, I used the "printscreen" button on the keyboard, copying the screen image to the computer's clipboard, and then pasting the map to a graphics package where it was cropped and resized, before printing out for use in their table top task. The outcome of the activity, mediated by small group discussion, was to create a poster/map, where the route for our walk and staging points on our journey were marked, with labels and arrows placed to show the locations where our photographs had been taken.
This activity was in part inspired by tagged mapping activities I had spotted in the blogosphere, through the work of John Johnston and Anthony Evans, and show how, even without the "tech know how" it is possible in looking beyond the technology, to develop similar processes for use in the classroom. Thanks to input and encouragement by Tom and his blog, I have decided to have a go at transferring the table top task into the Web 2.0 world, and the remainder of this post is me thinking through how how I did this and how I might develop the activities worked on with my students.
In his post Adding Image and Videos to Quikmaps Tom Barrett explains the "how" process, of associating images with placemarks in Quikmaps, but before this can be done any images you wish to use must be collected and uploaded to a web space or host. A number of free sites enable this, among which are Flickr and Picasa. We have a school website, and each year group has it's own community and gallery spaces, where images and files can be stored, so it is here for my first go I have uploaded the images I intend to use in making my map.
Making The Map
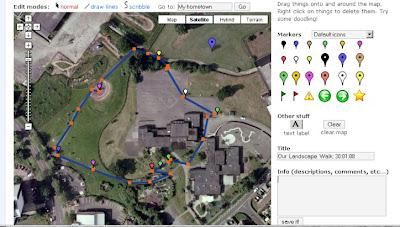
I created a quikmaps account a while back to play with, and for my previous post I had a prepared map. Having logged in and loaded this map the screen shot above shows this and the interface for the Quikmaps environment.
To create my map from scratch
With the map in the window, the tools above the map were used to draw, "doodle," on it, enabling me to mark and trace the route of our walk. Within the map window itself there are also tools to change the map type or view. The map can be viewed as a map, aerial photograph or hybrid, and to the left are a collection of zoom and navigation buttons.
In the space to the right of the map, are the place mark pins. These are added to locations on the map,
John Johnston has extended this to map wildlife images, captured on walks, while Tom has used histori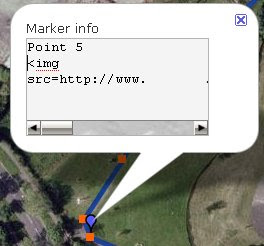 cal images with students to develop inferential activities around locations as they appeared in the past. Anthony used his quikmap to locate photographs of images he had taken of BeeBots, as he explored the ideas around a where in the world is... type project.
Here you can see an Information Bubble from my Quikmap, with the opening section of code, suggested in Tom's guide to embed a photograph.
On my map you can see that I included the route we took, using the line drawing tool, as well as the pins for each staging point on the way.
Preparing my Images
Having created my map, I now need to prepare my images. I don't want to use vast pickies, in any of my pages, as big images mean particularly on a page with multiple images slower download speeds. A while back I decided that I would use standard sized smaller graphics on my pages, in school and at home. In sessions with students and colleagues I also taught them how and why this was necessary, and have downloaded the MS Powertool "image resizer," a simple to use batch conversion tool, installing this on the school network to help me and the students with this process.
Once installed, using this Windows XP extension, is really straightforward.
For my web graphics I usually opt for the "Win CE" option. Since I am going to upload these to my school web space and I may decide to put multiple images in a bubble this is the size I will use today.
I author, edit and publish our school website using MS Frontpage, so I guess the next step is to copy my resized images to the gallery folder of the website and upload them... Working with the students at school, I could also open the site as a web folder, log in and then copy the images to the site.
Using Flikr or Picassa this is the point at which I would log onto the site and upload my images to a gallery here.
In for a Penny In For A Pound
Ok I have my images uploaded to my webspace, I have made my map, now for the moment of truth. Adding the image source tag to the bubble the web address (url) of the image, then closing the tag... Yay! it works!
Now I will select the tag code by clicking and dragging
Adding A quikmaps widget to the blog
Now I have finished my map, tested it and know that it works, I have decided to include it in my blog using a widget from widget box. Having ssaved my map, and then selected to add "this map in your site"
I clicked the add widget button
clicked the embed source code button
clicked the copy code to clipboard button
and in blogger, pasted the code to the page here in html view.
This process has been a really exciting development for me, a new tool to add to my Humanities and Data Logging toolbox, and to develop for use with Tizz our traveling bear.
However for anyone, who like myself, is also thinking about mobile technologies right now, this seems to me to be one further exemplification of a context where the "collect, store and share" affordance of these tools, discussed in previous posts, would be really useful. Students on a school visits, capturing images, making notes, perhaps even recording sounds or short video clips that on return to school, could be tagged and linked to create quikmaps of the locations they have visited. Even more powerful would be the addition of the resources being captured in real time. Use of 3g tools and moblogging in the field; using prepared maps of visit locations and place markers or GPS, students could potentially use prepared maps, and add resources, tag locations as they work, making this resource an additional tool in the "collect, store and share" process.
Back on the ground for a moment, and back with my own students, this tool will be extremely helpful in consolidating their understanding of spatial relationships. particularly their place in space, as we are able to dynamically zoom in and out of the locality they live.
My next step, is to use this tool with them to explore food journeys. Next term I want to use a visit a local Supermarket, to look at the journey of some of their favourite foods, or their five a day. Using a walk around the supermarket as a starting point to identify where in the world their food comes from, it will be interesting to tag these locations on a quikmap, and to begin not only considering where they are grown, but how they get to us. In terms of the National Curriculum for Geography the tool will take on two roles
1) as a data logger, the site and map created will facilitate the storage of data, and marking of the relative locations of each source to our home locality.
2) As a dynamic environment, we will also be able to begin considering the wider connections between ourselves and other locations.
It might be interesting for the students to begin linking our web based resources to the personal atlases they have been making, and in terms of Geographical concepts already developed in the process, to discuss with them and other colleagues how this "dynamic personal mapping" type approach, might be developed to create an ongoing resource, that students can develop and expand as they move through school. But this will no doubt be another story.
Note to self: Consider with colleagues how this tool might be used to modify and innovate QCA Geography Units
In class a couple of weeks back, my Y3 students mapped a "landscape walk" locating images collected by "tagging" them on a table top map. This map used an aerial photograph I had previously made and then screen captured from quickmaps. To capture the map, for use in the classroom, I used the "printscreen" button on the keyboard, copying the screen image to the computer's clipboard, and then pasting the map to a graphics package where it was cropped and resized, before printing out for use in their table top task. The outcome of the activity, mediated by small group discussion, was to create a poster/map, where the route for our walk and staging points on our journey were marked, with labels and arrows placed to show the locations where our photographs had been taken.
This activity was in part inspired by tagged mapping activities I had spotted in the blogosphere, through the work of John Johnston and Anthony Evans, and show how, even without the "tech know how" it is possible in looking beyond the technology, to develop similar processes for use in the classroom. Thanks to input and encouragement by Tom and his blog, I have decided to have a go at transferring the table top task into the Web 2.0 world, and the remainder of this post is me thinking through how how I did this and how I might develop the activities worked on with my students.
In his post Adding Image and Videos to Quikmaps Tom Barrett explains the "how" process, of associating images with placemarks in Quikmaps, but before this can be done any images you wish to use must be collected and uploaded to a web space or host. A number of free sites enable this, among which are Flickr and Picasa. We have a school website, and each year group has it's own community and gallery spaces, where images and files can be stored, so it is here for my first go I have uploaded the images I intend to use in making my map.
Making The Map

I created a quikmaps account a while back to play with, and for my previous post I had a prepared map. Having logged in and loaded this map the screen shot above shows this and the interface for the Quikmaps environment.
To create my map from scratch
- I used the search tool to navigate to the approximate location I wanted to create a map for.
- Using the zoom tools I refined my location,
- I centred my map by using the hand grab tool to move it until the location I wanted appeared in the middle of my map window.
With the map in the window, the tools above the map were used to draw, "doodle," on it, enabling me to mark and trace the route of our walk. Within the map window itself there are also tools to change the map type or view. The map can be viewed as a map, aerial photograph or hybrid, and to the left are a collection of zoom and navigation buttons.
In the space to the right of the map, are the place mark pins. These are added to locations on the map,
- By picking them up with the hand grab tool
- dragging them to the place you want them on the map
- Dropping them in place.
- Once on the map they can be picked up again to refine our location
John Johnston has extended this to map wildlife images, captured on walks, while Tom has used histori
 cal images with students to develop inferential activities around locations as they appeared in the past. Anthony used his quikmap to locate photographs of images he had taken of BeeBots, as he explored the ideas around a where in the world is... type project.
Here you can see an Information Bubble from my Quikmap, with the opening section of code, suggested in Tom's guide to embed a photograph.
On my map you can see that I included the route we took, using the line drawing tool, as well as the pins for each staging point on the way.
Preparing my Images
Having created my map, I now need to prepare my images. I don't want to use vast pickies, in any of my pages, as big images mean particularly on a page with multiple images slower download speeds. A while back I decided that I would use standard sized smaller graphics on my pages, in school and at home. In sessions with students and colleagues I also taught them how and why this was necessary, and have downloaded the MS Powertool "image resizer," a simple to use batch conversion tool, installing this on the school network to help me and the students with this process.
Once installed, using this Windows XP extension, is really straightforward.
- Copy all of the images you wish to use to a folder
- Select the images you want to resize
- Right click to open the file context menu
- From the menu click resize pictures
- In the dialogue box that appears select the image size you require.
For my web graphics I usually opt for the "Win CE" option. Since I am going to upload these to my school web space and I may decide to put multiple images in a bubble this is the size I will use today.
I author, edit and publish our school website using MS Frontpage, so I guess the next step is to copy my resized images to the gallery folder of the website and upload them... Working with the students at school, I could also open the site as a web folder, log in and then copy the images to the site.
Using Flikr or Picassa this is the point at which I would log onto the site and upload my images to a gallery here.
In for a Penny In For A Pound
Ok I have my images uploaded to my webspace, I have made my map, now for the moment of truth. Adding the image source tag to the bubble the web address (url) of the image, then closing the tag... Yay! it works!
Now I will select the tag code by clicking and dragging
- right click the code
- Select copy from the menu
- Open the new placemarker bubble
- right click and paste this tag,
- and edit the image file name (.jpg) to enable the code to locate these new images.
Adding A quikmaps widget to the blog
Now I have finished my map, tested it and know that it works, I have decided to include it in my blog using a widget from widget box. Having ssaved my map, and then selected to add "this map in your site"
I clicked the add widget button
clicked the embed source code button
clicked the copy code to clipboard button
and in blogger, pasted the code to the page here in html view.

This process has been a really exciting development for me, a new tool to add to my Humanities and Data Logging toolbox, and to develop for use with Tizz our traveling bear.
However for anyone, who like myself, is also thinking about mobile technologies right now, this seems to me to be one further exemplification of a context where the "collect, store and share" affordance of these tools, discussed in previous posts, would be really useful. Students on a school visits, capturing images, making notes, perhaps even recording sounds or short video clips that on return to school, could be tagged and linked to create quikmaps of the locations they have visited. Even more powerful would be the addition of the resources being captured in real time. Use of 3g tools and moblogging in the field; using prepared maps of visit locations and place markers or GPS, students could potentially use prepared maps, and add resources, tag locations as they work, making this resource an additional tool in the "collect, store and share" process.
Back on the ground for a moment, and back with my own students, this tool will be extremely helpful in consolidating their understanding of spatial relationships. particularly their place in space, as we are able to dynamically zoom in and out of the locality they live.
My next step, is to use this tool with them to explore food journeys. Next term I want to use a visit a local Supermarket, to look at the journey of some of their favourite foods, or their five a day. Using a walk around the supermarket as a starting point to identify where in the world their food comes from, it will be interesting to tag these locations on a quikmap, and to begin not only considering where they are grown, but how they get to us. In terms of the National Curriculum for Geography the tool will take on two roles
1) as a data logger, the site and map created will facilitate the storage of data, and marking of the relative locations of each source to our home locality.
2) As a dynamic environment, we will also be able to begin considering the wider connections between ourselves and other locations.
It might be interesting for the students to begin linking our web based resources to the personal atlases they have been making, and in terms of Geographical concepts already developed in the process, to discuss with them and other colleagues how this "dynamic personal mapping" type approach, might be developed to create an ongoing resource, that students can develop and expand as they move through school. But this will no doubt be another story.
Note to self: Consider with colleagues how this tool might be used to modify and innovate QCA Geography Units
9.2.08
Honeycomb Video Demonstrations
Doug Dickinson has published a link to his video demonstrations of Softease's new Web 2.0 Learning Environment Honeycomb. This tool really excited me on my visit to BETT08, not as a standalone system, but its potential to engage students and teachers in content development, management and sharing within a learning centred toolbox approach to the use of ICTs. Check out the tool and its affordances for your self by visiting this link
7.2.08
Story Telling Legends
 In a recent post I charted my thoughts as I worked through planning my use of multimodal texts and resources to support a writing unit around Myths and Legends. The four weeks of this extended language unit have passed and my class are now eagerly publishing their work. The outcomes as I hinted are their own takes on a local legend about the Stanton Drew Stone Circle.
Drawing on a picturebook originally created by a group of year 4 students, we began a week long big write drafting our text in sections, working firstly on the beginning and then the end, before returning to write the bit they all really wanted to get stuck into, the appearance of the demon fiddler. My intention was to draw on an extended process of talking for writing, role play and experience and exploration of a range of multimodal text types, to help develop their sense of authorship. Working from a strong opening and close, I wanted to contextualise and strengthen their central section of the narrative, an area where previously they have fallen fowl to dialogue based narrative. In order to challenge and encourage use of adventurous vocabulary students were also given an older audience to write for.
Engaging with the text in this way meant as a group the students needed to apply their thinking to how their narrative would develop and flow, as they worked to link the opening and closing sections of their story. Seeing themselves through the eyes of their reader (listener), creating a context for their role of author as designer.
The story itself was a fantastic choice as it turns out, really excited them, firing their imagination and inspiring some fabulous language use. Having rehearsed their narratives for writing, within the drafting process using what we have come to call "podcast voices" on completion, they have asked to publish their stories as a part of their class podcast.
This week working in pairs, the students have been helping each other rehearse their performances. Working through this process has supported further refining and revision of their texts as oral rehearsal and playback highlighted elements that needed to be changed to enable sense making. The students have also taken on roles within the recording process, one acting as director and engineer recording the story while the other performs it, before swapping over on completion of the process.
Colleagues who have observed the students using Podium our chosen recording tool, during this process, have commented on how exciting it has been to see the children engaged in
- discussing, reviewing and polishing their oral presentation,
- situational learning, refining something of which they were already rightly proud,
- using and applying a growing understanding of purpose and audience to ground their engagement in meaning making
Subscribe to:
Comments (Atom)