Pages

23.6.08

How Has Podcasting Helped Me With My Learning?

Last summer at about this time I published a post, " So what do you think the children get from Podcasting?" Since then I have extended my adventures, using Podium as a tool to support talking for writing and having posted my thoughts for the past 6 months, I thought I should share my students ideas about how the tool has supported their learning. I am currently writing student reports. Part of our reporting process is a series of Teacher/Learner Conferences, where we share and set targets and review our progress. The children are asked about things they feel they have made improvements in, things they still need to develop, and finally the things that they think have helped them to move on with their learning. Last week I began my end of year reviews, and several students mentioned how the podcasting process had helped them. I will not expand on this any more for the time but hand you over to the voice of my class. Here are some quotations lifted directly from conversations with students in my class.
  • Podcasting and talking for writing have helped me to, think about if my sentences and the things I am writing make sense, so I can go back and change them
  • Podcasting has helped me because I could listen to myself and then go back and correct the things I have written.
  • I like podcasting because it is fun, and it has helped me to think about full stops and capital letters in my reading and writing.
  • I really want to work on my reading, I want to make better sense of things, and read with expression, because I really like podcasting... We do lots of talking for writing before we write things and this also helps me get my ideas sorted before we work.
  • I like it when we get the chance to go over stuff again, so I can see where I went wrong. I have really liked podcasting too because it has helped me think about my punctuation, and what kind to use.
I Look forward to any thoughts you may have.

14.6.08

Storyphones: Language for Learning

With the increased availability of cheaper MP3 players, I have pondered buying a few to use with portable speakers. The main problem is that this would further add to the cacophony that already exists in my talk driven classroom, or require children to take turns with headphones. I could not really see a way of enabling multiple access to the device without a portable speaker or docking option. Then today this was published on Ictopus, about a new device the Storyphone. What a cool idea, essentially a wireless mp3 based listening centre.

I love the effect that podcasting and audio recording has had on my student's perception of reading and its purpose, and have wondered for a while about how we could use this to our advantage, in having students prepare stories for others around school. Either performing from existing texts or preparing their own for sharing through the network. The recording part would be fairly straightforward but individual or group access as said above to the completed texts more of a challenge, requiring either computers to be tied up or access to individual mp3 players. I realy like the idea of the storyphone on soooooooo many levels! Or something similar, and would encourage the company to ask the question "Why stop with selling this idea as a foundation stage tool?" I would love to have something similar available to use more widely with students of all ages across my school, how about you?

Softease Branch, Y3 and the Properties of Shape

As we aproach the end of term and the end of another school year, I am in the process of what might be called mopping up, looking at areas from the Mathematics framework that we have either not yet engaged with, or which the students have found tricky. Alongside this are some ICT curricular elements that I have not fully developed with the students. We have used data handling environments to for example present data from Science Experiments and as teaching aids with the IWB, but the children themselves have had limited independent access to the tools, other than in small groups at classroom based PCs.

This week we have been involved as a class in a Using and Aplying Mathematics unit, to consolidate our use of vocabulary relating to the properties of 2d shape. At the same time I wanted to embed and develop key skills from the ICT curriculum through the use of a Branching data base. The tool I chose to use for this series of tasks comes from Softease Studio, and is called Branch.

The sessions began however, not with Branch, but with a drag and drop sorting tool I had made using Smart Notebook. Other whiteboard users could make something similar, and an image of the tool is presented to the left for reference. The key to making and using Branching Data bases, binary trees or "dichotomous keys" is an ability to generate, ask and use "null" questions to divide a set of objects into two sets initially, gradually refining questions to distill the set until the branches at the end of the tree have only one object. This involves asking questions that have "yes or no" answers. This is process I have found easiest to develop using the observable features and properties of sets or collections of familiar objects. We often use Carrol Diagrams and Venn diagrams to do this, and the whiteboard tool I used as an introductory frame to support student and teacher discussion around this process before engaging with Branch itself, was designed to act as a link between these tools.

Since our task had a mathematical focus, we began with the shapes to the left of the book engaging the children in paired discussions around questions such as
  • What can you see?
  • What is Special about this shape?
  • How is this shape different to or the same as this shape?
These were used to focus the students attention around the visible properties of the shapes, and to begin drawing on their prior experiences to describe them, for example

"It has four sides and four corners, all of the corners are right angles."

A great set of reponses describing the properties of a rectangle, however in our set we had two rectangles, a square and an oblong. Developing this we began to use the sorting tree model above dragging the two rectangles to the top of the simple tree, and asking the students to propose questions that focussed how they were different. Is it a rectangle ? Or does it have right angles? don't work since both shapes have right angles and by defintition are both rectangles. Are all the sides the same length? Provides a yes or no answer and allows the two shape to be separated.

We used the notebook to practice this idea together, comparing a number of shapes from our collection and then, testing our questions to see if they worked. The children were then introduced to branch and starting with only two shapes each time initially were were encouraged to make a series of trees practicing and rehearsing their questions together.

During follow up sessions the idea of working with 4 shapes was introduced and the children challenged to devise questions that would begin by dividing their shapes into two equal sets. This sounds easier than it is. Eg I have a square, an oblong a triangle and a pentagon. A good starting question might be does the shape have right angles? Does the shape have 4 sides? And because of our previous activity the children suggested these? From here the next question was also fairly straightforward for them based on the practice sessions of small trees the day before. However what happens if we drag a circle, a triangle, a square and a pentagon into the tree? Is it curved? Does it have three sides? Although having yes or no answers don't work in relation to the challenge question set at the beginning of the session. What is needed is to ask a question such as does the shape have "more" or "less" than x numbber of sides/corners/angles? The students were then encouraged to use Branch to explore these ideas, Before during our final session requiring the children to begin with 8 given shapes to design a game for their friends to play and test out.

The children really enjoyed this series of tasks, which challenged their thinking and enabled them through paired discussion to use and apply vocabulary developed in previous classroom based sessions to a decision making process. The UK Primary Mathematics Framework says students in the course of their work should

  • Follow a line of enquiry by deciding what information is important; make and use lists, tables and graphs to organise and interpret the information
  • Describe and explain methods, choices and solutions to puzzles and problems, orally and in writing, using pictures and diagrams
  • Use Venn diagrams or Carroll diagrams to sort data and objects using more than one criterion
  • Relate 2-D shapes and 3-D solids to drawings of them; describe, visualise, classify, draw and make the shapes.
As a guided and collaboratively based series of activities, using Branch in this way really helped support and scaffold this particular group of students engagement and discussion around these processes. It also enabled me to give context to the use of a tool that I have found frequently to be used because it is expected within the ICT scheme of work structure. As with many ICT tools I feel Branching data bases are incredibly useful and powerful tools, if they are used in designed and considered cross curricular learning situations where they can act as a "person plus," or a frame and scaffold to support use, application and transfer of skills and experience from one subject domain to another.

13.6.08

How to write...

in 1000 words or less. Just found and skim read this post from Lifehack, really like what I have read so far something to come back to later.

12.6.08

Pondering on visual storytelling

We have been sharing adventure stories and traditional tales with a twist, during Literacy Sessions for the last couple of weeks, and this week we have particualrly focussed on another of my favourites The Paper Bag Princess, By Robert N. Munsch.

My students seem to really enjoy, my taking a story I love and then trying to retell it in my own words. Perhaps this has come from the podcasting work we have done and their appreciation of how challenging this can be for them at times, or perhaps it simply comes from watching and listening as I try to recount and embellish the tales going through the mental processes I expect of them, visualising, mentally rehearsing and then retelling the tales as they develop. Hopefully though it is also because they recognise the magic of ideas. A story although in existence can still be reshaped, reformed, and refined in the mind of the teller. Even great stories and books such as this are made and altered through performance and enhanced by our interpretations and imaginings. This story telling process however I feel closely models and mirrors the path I currently using in encouraging the talking for writing process. Multimodal views of literacy see written text as "oral text," a symbolic permanent or semi permanant record of what it is we want to say or wish others to hear. Maybe as experienced writers this is something we have lost sight of in the teaching of writing. How many times do we say to ourselves, "hang on that doesn't sound right!" Perhaps we have forgotten over time that the voice we hear, and link to our actions as writers, took years not only to perfect but also to internalise. A forgotten part of our writing repertoire, however this is something which in the primary sector particularly many of our students are either only beginning with or are still in the process of developing. It took an introductory course in Semiotics, communication and representation recently, to actually challenge my perceptions and help me to realise just how complex this process must be. It was great this week then, when the students having eventually read The Paper Bag Princess themselves for the first time, to hear expressions about how they had already read this story, not heard it as I might have expected, and beginning I hope to make the link even if inadvertently between the spoken word and written text they were engaged with.

Over the last couple of days the students have begun to move on from the reading process to begin talking together, planning, mapping out and rehearsing potential plot elements for their own versions of the story. We have discussed and collected new titles for the story to help us innovate on the text, these include such barnstormers as; The Trash Can Princess, The Wheely Binbag Princess and so on, all of which have potential to influence the reactions of other characters in the story, and effect closing dialogue between the princess and the kidnapped prince charming she sets out to rescue. In the process the children have also created some fabulous story maps, and it is these that have prompted this post.

Stimulated by the discussion which began to emerge from the class and the quality of the illustrations the children generated around the story, I have decided to trial something a little bit different in tandem with the story writing process itself. We often use role play and freeze framing as part of our talk for writing process and in a previous post I talked about how interesting it might be to use elements of the Commoncraft approach to animation to support visual storytelling. Having watched the recent release of the Indiana Jones trilogy that featured some really great animated storyboards, I was really fired up to have a go at using this to frame my in to the process. This week we began making scenery and cutout characters, to support the idea of multimedia storyboarding. I am hoping this will inspire the children and help with rehearsing story sequence, something one or two are still finding difficulty with. The idea revolves around using the scenery and character cutouts to frame scenes from the story, capturing these as digital photographs and then using Photostory to sequence the scenes and events. From here I would like the children to add voice overs to tell the story with completed outcomes for publication as simple group movies.

For my more able students I hope this will help extend and expand their vocabulary use and help with the text revision process as they write, while for others, some who are still reluctant to record, or having problems in maintaining logical sequencing as they move from plot element to plot element, that this visual and oral story prompt will help scaffold their progression through the story events they want to tell.

27.5.08

From Probot to LOGO: Some previous posts in action

I have put together this photo montage for the time being to share some of the activities my students have engaged in while using Probots and MSWLOGO this term. Even though presented here in an ICT context, references placed towards the end of this post highlight a number of areas from the Primary Framework for Mathematics with which the children engaged, through the using and applying strand, and which draw into focus the cross curricular potential of work such as this to help children make links between areas of learning.


The file is progressive and begins with the children using the probot to create skeletons around which they made and then decorated their own floor compasses. From here working in groups the students used their floor compasses to learn about compass direction, predicting outcomes from given inputs, eg if I am facing east, and make a 1/4 turn east what direction will I be facing? This required them to know and use the numerical values for rotation sizes, or to calculate these using halving and doubling strategies. Within the problems set we also replaced fractions of a turn with the number of degrees, and the directions of a rotation with clockwise/anticlockwise, and right/left. The children went on from this to make up challenge questions for their friends in other groups.

In the next series of activities the children made mazes using strips of paper. Working initially with right angles, some children chose to extend the activity to include 45 degree turns. The children used their knowledge that a Probot step was 1 cm to help them measure the distances the probot would need to move, and estimation to predict and test the size of turn they would need to make at each point in order to navigate the maze. After step by step planning the children were asked to input procedures, that would take the turtle from one end of the maze to the other without stopping.

The final photographs in the series represent a session in the ICT suite where children used MSW LOGO for the first time. The students were given a prepared treasure map which they loaded into the LOGO workspace, before we discussed as a class and decided the route around the island we would take, or the order in which we would visit particular landmarks. Transferring the floor based experiences of the students to the screen was not difficult, and after only a brief introduction to the commands and how these should be input, they worked very successfully and independently, to resolve many of the issues they encountered. In the plenary to this session the children were asked what they would like to do in the next session, and suggested that they would like to have a blank treasure map, that they could add landmarks to themselves, they could then ask their friends to journey around their island following a route they had prepared.

This series of activities, as well as the obvious ICT and Geographical links, offered opportunities for the students to engage practically with the following strands and related objectives from the Primary Framework for Mathematics

Measuring
  • Know the relationships between.., metres and centimetres..., choose and use appropriate units to estimate, measure and record measurements
  • Read, to the nearest division and half-division, scales that are numbered or partially numbered; use the information to measure and draw to a suitable degree of accuracy
Understanding Shape
  • Read and record the vocabulary of position, direction and movement, using the four compass directions to describe movement about a grid
  • Use a set-square to draw right angles and to identify right angles in 2-D shapes; compare angles with a right angle; recognise that a straight line is equivalent to two right angles
Counting and Understanding Number
  • Read and write proper fractions, interpreting the denominator as the parts of a whole and the numerator as the number of parts; identify and estimate fractions of shapes;
While using and applying their knowledge and understanding of these areas in the context of problems and puzzles.

Many of the activities here are drawn from or build on previous posts that can be found within the control category to the left of the page.

26.5.08

Explanatory Texts From a Multimodal Starting Point

As a class this term we have been reading the Amanda Mitchison Biography "Who was... ? Isambard Kingdom Brunel." The story even though a challenge in places has fascinated the students. The book has proven to be a fantastic stimulus for discussion about the "great man of Iron" but when combined with web based images and tools has also stimulated high quality talk for writing in support of mechanism based explanatory texts .

Of Worms and Men..

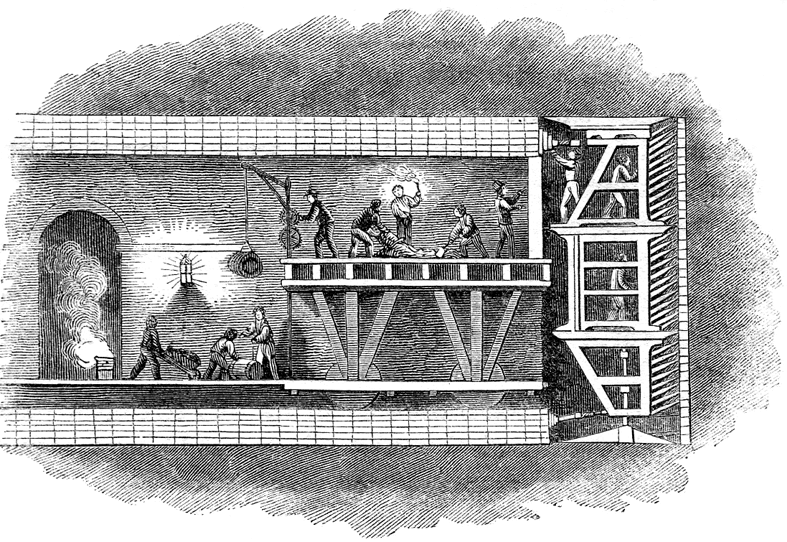
The tunnelling shield invented by Brunel's father, appeared in the opening chapter of the biography and was a great starting point for discussion, one which began with Marc Brunel's observing ship worms at Chatham Docks, before inspiring his idea to dig tunnels through a process of removing spoil, inching men forward in a protective shell and lining with bricks the space behind them as they work. This principle is still employed in modern tunneling, and the enormous tunnel boring machines we see today work on a similar basis. The use of modern control technologies, machine automation of processes, global positioning and monitoring and sensing technologies may have improved navigational accuracy, speeded up the process, but it is no less dangerous today than in the past, spoil still must be removed and the machinery maintained, driven and programs planned, miners still scurry around in the spaces between the tool and the tunnel, lining it as the machine edges forward. The system has advanced, but even as the technology charges on, the principles of its evolution and in many ways its operation remain similar to those originated in Brunel's time. A need is identified, available designs and tools explored affordances exploited to identify possible solutions, before adaptations or innovations are made on these to create a product that either meets our needs, or carries us forward into the unknown. As we have read Brunel's story together I have tried to be mindful of this in the discussions we have had, not only talking about the great man's life and works, but also exploring the similarities between old and new technologies. Not only is this a valuable place to be in terms of historical investigation, comparing past and present, but an essential process based conversation to have in light of a DT curriculum in the England that requires students to engage as designers and makers through Investigation Dissassembly and Evaluation Processes, and an ICT curriculum that requires a similar set of processes to evolve beyond the skills based aspects of the curriculum in developing ideas and exploring the impact of ICT on everyday life.

In terms of Literacy development the formal use of terms relating to "cause and effect" are not common place in the talk that we use or encounter. The written genre of explanation requires us to write from an impersonal perspective and to use "Causal Connectives" such as "this causes, " "as a result," and so on. Taking an impersonal view of the action we are describing can be a real challenge, I remember myself writing science experiments up for the first time at secondary school and being reminded constantly that I needed to use impersonal pronouns while I tried to explain the process as if I wasn't involved. In essence this made the difference between my report being an explanatory text and a set of instructions or a recount. In talking about diagrams such as the tunnelling shield I began the process of modelling the language structures the students needed to hear, that would help them rehearse the written work they would use later. Recording these on the diagrams we explored as a flow chart.

Eg
Men standing in the shield dug out the soil and rock, which was thrown to the ground.
Labourers loaded the spoil into barrows, that were used to carry it out of the tunnel.
As the shield moved forward, the tunnel was lined with bricks, this helped support the roof... and so on.

As the students became more familiar with the sound of the genre, we began to collect some of the words and phrases we were using to display on our word wall.

Converging Technologies

For the last couple of weeks we have been using our literacy sessions to extend our experiences of writing explanatory texts while exploring how some of the technologies that enabled Brunel's visions to emerge worked. We focussed on steam engines and Steam Locomotives technologies Brunel did not invent but was keen to adapt and exploit in his endeavours. To explore the principles behind turning up and down movements into rotary movement to drive ships such as the great Eastern and Western we explored how stationary pumping engines worked. "North Star" one of the first locomotives to run on the Great Western Railway was built at Robert Stephenson's works in Newcastle, and as we had found some amazing material online about Stephenson's Rocket we decided to use this as a model to help us find out about how Brunel's locomotives worked.

Multimodal Starting Points Using Talk to Promote Writing

Within this unit although using some written texts initially to support how the features of an explanatory text are presented and work, most of our activity involved making and using models, and exploring video presentations and animations to help the talk for writing process. During the first week we used videos from Espresso, to share visual and audio descriptions of the processes involved in powering a Bolton and Watt Stationary Beam Engine. We used these video texts to scaffold and rehearse verbal explanations of how the engine worked. As a class we made cardboard models, including linkages and a background diagram of the engine to help us create the link between our talk and the writing we would later engage in. As the children worked with these they were encouraged to talk about share and rehearse with their partners their growing understanding of how these machines worked, gradually being encouraged to expand and present their oral explanations to include a range of sentence openers from our word wall and to begin including the causal connectives they would need to use in their written captions for presentation later in the week. The children were very excitied by the quality of the modelled outcomes they produced, but I was also really impressed by the quality of written outcome produced.

The second week, of activity involved the students in expanding the process previously worked on by creating a similar model of Stephenson's Rocket. We began with the image below left, before the students began creating their own background diagrams similar to that on the right. The students were given a cut out drive wheel to begin with, and the large wheel space at the front drawn in as their starting point. While discussing the source image we also identified that this drive wheel would be where our mechanism would be added to the diagram later in order to give a sense of scale to their drawings.

To support the sessions as the week progressed we used this nice Flash animation from the BBC website as our stimulus for talking for writing. It helped us decide what the mechanism we needed would look like, and to pick out the four key processes we would include. The Steps in our explanation would be

1) Firing up the engine (how the water was heated)
2) Water turning to steam (why the water was heated)
3) Steam forces down the Piston (what the steam was for)
4) The drive shaft turns the wheel (the outcome of all this effort)

On completion of the diagram and mechanism the children were encouraged to explain the process orally to partners and rehearse the captions they would add.
They were challenged to use a variety of sentence openers interestingly several of the students used time connectives they had collected in previous writing session and units to do this. Among the success criteria for the activity was also the need to use the causal connectives we had collected link action with outcome in their model as they described them. I have been really excited by the quality of the children's work. I haven't any photographs of the outcomes from this activity yet, but will include an example or two later. Combining multimodal text use, talk for writing and animated mechanisms however did have a dramatic effect on the way the students finally presented their outcomes. Linking the use of DT to model the process not only gave context to scaffold talk for writing but beyond the DT and literacy based experiences gained from this series of activities, the students were also helped to make links between this and their science work on forces using magnets and springs, and to apply language developed here in their ICT unit on control as we explored how input brings about output.

Image Credits:
Tunnelling Shield from Wikipaedia
Stephenson's Rocket Cutaway From BBC
Student work and outcomes SDMills

5.5.08

Using Textease to make Hide and Reveal Tools

I am commited to a multiple tool approach to working with ICTs and keen to explore as many tools as possible, when writing or developing classroom activities for students rather than simply promoting and sticking with the ones I am most familiar. I feel it is important to be mindful that any one tool rarely meets the identified learning outcomes or the processes we want to use the tools for, either in resource development or with the students during projects. Following my interview with James for the Podium Podcast during half term, I was forwarded some Textease files to play with, they didn't quite fit the bill in terms of the resources I was working on but did excite me in terms of how they and the environment could be used to develop resources and model and make pictograms with students.

There are a number of available tools that can be used to create pictograms as tally charts. Tools such as Interactive-resources' Maths Pack 2 include flash based ITPs that enable class tally charts and pictograms to be made, by dragging or clicking to reveal images. These can be used to support discussion and preparation for students to engage with other data handling processes. IWB Notebooks too can be made, drawing axes using the line tools, then stacks of images created for drag and drop, using the clipart gallery and clone tools to create more personalised pictogram as tally surveys.

The method used to create the pictogram files with Textease, allows a hybridisation of the two process, using the hyperlink tool in the software to create an onclick event. That is to say, to create a file that when spaces within the chart are clicked or pressed, reveal an image or object.

So How do we do this?

The first step in creating a pictogram file is to decide what your survey will be about, and then to collect and import images that will represent and support the data collection process. These images can either be selected from the extensive clip bank provided by the software, or imported from outside the tool.

To create my pictogram I began by inserting one of each image I wanted to use, resizing each one to scale to the chart space I was using. With the images in place and resized I selected, then copied them, pasting repeatedly until I had the number of images I wanted to use in each area of the chart. Next I arranged the images in columns as shown in this image.


Unfotunately at the moment there is no quick way to carry out the following step, which is to create the onclick effect, so each image must have the effect applied individually.

Adding the Onclick Effect

1) Click to select the image (object) you want to hide and reveal on click.
2) Select the hyperlink button from the tool bar
3) Click the animate tag
4) Click in the "hide/show on click," and "hidden on open" tick boxes
5) Click close

Clicking off the object, the next time it is clicked, it disapears. Clicking on the object again, or rather the space where it should be, reveals it or makes it appear.

Now saving the file and closing it, when opened again it presents the viewer with an empty set of axis, and clicking in the spaces reveals the images hidden there. This tool can now be used with the class to collect data, on our journey to school today as a personalised ITP.

However if your school has a network or site license for the suite of tools, the file can also be shared with students to work on themselves. By placing a copy of the file in a shared folder on the network, students can open softease, and the file to work on themselves; customise it based on their own surveys, perhaps by visiting other classes, or the one developed by the class. They could add personalised titles and axis labels, and "save the file as", to personal spaces to maintain the original template.

As you can see the process of creating the file is fairly straightforward so students could also be helped or shown how to make their own and not ticking or unticking the "hidden on open" box, the survey data can be maintained, for use in other work. The outcomes of activities using this tool can also be saved directly or printed out, without the need to copy the screen to another software environment, which is neccesary when using ITPs such as those mentioned earlier. Providing template files with onclick reveal means this activity would be ideal for use with younger students making pictograms, where the charts can be generated quickly, and the focus of Data Handling activity, that of solving problems and asking and answering questions reache with increased pace. Thanks to Doug and James for sharing this technique with me. I hope the post has done it justice.

2.5.08

Which of the Web's Birthdays Will You Celebrate?

Thanks to Andrea Dunn, for posting a link to this very accesible BBC article about the origins and birth of the World Wide Web. 15 years old this week (again)? A Hippo Birdie 2 ewes!

28.4.08

Mapping Landmarks; Digitising the Anologue

Wanted to share a nice activity that we worked on in class today. Our theme is based around being a Bristolian, and last week we identified some of the student's and our favourite places in the city, charting these and creating a simple postcard.

Using the landmarks the students had identified, we compiled a collection of labeled digital photographs, printing them out to use with a tourist map in this group challenge. The following learning story, was compiled in Microsoft Photostory, and uploaded to Google video for sharing.


26.4.08

2Type or Not 2Type: 4

In a previous post, 2type or not 2type, I presented a few thoughts about 2 Simple's 2Type. I was grateful for a number of colleague reactions to this post, offering additional thoughts about keyboarding and tools available to support the development of this key skill.

Anthony Evans and colleagues in Redbridge carried out a school based pilot and action research project using 2 type, his blog post "Touch Typing," presents an evaluation of the project, and is a fantastic place to start thinking about the pros and cons of keyboarding tools and how we might design learning situations that include them in the classroom.

Doug Dickinson aso at this time suggested a number of "no cost" tools to support keyboard skill development including
Thanks to John Sutton @ Creative ICT for directing me to Keybdr.com this morning. This site is another online tool for practicing keyboarding, but there is much more to it than first meets the eye. As well as offering random "natural" text to input, and tools to monitor words per minute; the input language can be altered, and through a cool site feature, a url or feed address can be added to capture text directly for input from elsewhere on the web for copy typing and practice. This certainly is a real timesaver for setting up activities with older students, who could be provided with the url of a particular web space, selected perhaps for theme relevance, to practice their keyboarding while engaging with its content. The "about," tab on the site offers ideas about how to use the game, and explanations of how to change language input and how to enter urls and feeds to support copy text generation . Have fun.

24.4.08

South West Regional ICT Conference 2008

July 2nd sees the 10th South West Regional ICT Conference to be held at the University of the West of England here in Bristol.

This one day regional ICT conference, is a fantastic locally organised event aimed at members of the whole school community from classroom teachers to school governors. It is an opportunity to celebrate with colleagues and share in their experiences of using ICT in the classroom through presentation and seminar, to network and explore tools first hand with exhibitors, while gaining inspiration from the endeavours of a diverse community of practice. This year keynotes come from Doug Brown, John Davitt and Russell Prue. To get a flavour of what is happening at this year's event the programme can be downloaded from here, while an archive of presentations and audio files from previous years including last years inspirational key notes by Prof. Stephen Heppel and Lord David Putnam are available here.


I have exhibited student work a couple of times at the conference, but this year am really looking forward to the opportunity to share some of my experiences in a presentation around cross curricular opportunities for Control.Inspired by Doug Dickinson this is hopefully going to be bit of a blogging experiment too. I am saving the rest for later.

22.4.08

So What is Podcasting?

I was really pleased to find this in my feeds today, a video from the fine folk at CommonCraft that explains podcasting as only they can... Ladies and Gentleman this is Podcasting in Plain English

21.4.08

Podcasting about Podcasting

Last week, I was interviewed by James Watson of Softease, about my experiences using their school podcasting solution Podium in the classroom. James has used this interview in his own Podium created podcast called Podcasting in the classroom launched today through the Podium Blog

The first episode features James himself introducing the series and its aims, and eloquently explaining what Podcasting is (and is not) while outlining some of the benefits the process may offer for engaging learners in the classroom. The second episode features an interview with the voice behind this blog, recorded last week, sharing his experiences of using Podium in the classroom while exploring and expanding on some of the ideas, I have written about here. I hope you find this useful, but also that you take the opportunity to subscribe to what promises to be an interesting series of programmes. I am certainly looking forward to downloading and listening to future episodes and sharing in how others are using podcasting as a tool to engage students and inspire learning in their classroom. Thanks James:o)

20.4.08

Stick Figure Animator is still a hit

Untitled Animation by C. Click on the image to view the animation.

A while back I published a stick figure animation by one of my students called "The Box." He recently sent me another creation, with no title, and here it is. For some reason Blogger doesn't want to play the file in the page but clicking on the image will open and play the file in a new page. I really like it, because knowing C and the software tool he used I recognise how much effort has been put into its creation and how the narrative it carries draws on and expresses an enormous amount about the visual nature of the process he brings to all his literacy activity. Every frame in this clip has been added by hand, and the narrative presented shows how far he has come, independently in his understanding of the animation process. Motion and transitions are much smoother in this movie than in his previous attempt.

It never ceases to amaze me just what our students are doing with ICTs when not in school, and how easy it is to underestimate their creativity and capabilties with the tools they use and have available to them. Well done C and thanks for sharing.

Eureka! Using Line Graphs to tell stories

I wanted to share this web based resource with everyone since I've been writing about data handling this week. Its been sitting, soaking and reclining in my bookmarks and at the bottom of the Maths recources page in our school web site for ages, but is a really nice resource to use as a starting point around time and change using line graphs.

Bathtime with Archimedes now on ColemanWeb, is an interactivity, that uses a combination of animation and pictorial representation to model the principles and effects of displacement. While users run the model a number of variables can be altered, you can turn on or off the tap, put in or remove the plug, and have Archimedes sit in or get out of the bath. As these "physical variables" are altered and the model is run, the level of water in the tub obviously changes, and this can be observed by watching the position of the rubber duck in the tub, my personal favourite touch, but also a line graph that is created to coincide with the events as they are carried out along the bottom of the page. Time and depth values are also recorded as the model runs in a table to the right of the screen.

As a "shared text" during maths or science sessions, this tool affords lovely opportunities to draw on the visual elements as the modelling process unfolds to support oral work, through engagement with the chart to recount the story and events that lead to its creation. Screen capturing the model, or a previously created model to an onscreen notebook, opens possibilities to engage students with the resultant image multimodally, and the use of hide and reveal techniques to mask areas of the image, promoting and focusing discussion, to draw on their previous experiences.

Following this up students could be provided with a one I prepared earlier version of a bath tub model presented as a line graph created in a spreadsheet, and asked to prepare a recount or story around the chart.

I put in the plug and ran my self a bath. I was just settling down when the phone rang, I got out of the tub, it was freezing as I dashed through the house but before I could get there the caller rang off. I clambered back into the tub. running some more hot water before laying back to relax.

Alternatively students could tell stories for others to sketch, using discussion to generate the charts they think would result from it. What do you think?

16.4.08

Making Dynamic and Interactive Pictograms With MS Excel

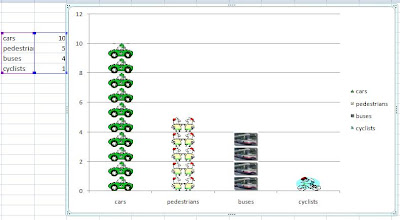
I've had a spot of Blogger's Block lately, but thought I'd try to get back into writing by asking what you think of my Pictogram? Cool huh! Inspired by a Twitter thread this week I thought I'd share the process I used to make it and a few thoughts about why this simple technique excited me so much when I discovered it accidentally and in true "IKEA man" style a while back.

I have used Excel with Key Stage 2 children to support data handling activity for a long time now. It was originally part of our BEON Project toolkit back in the 90's, but the more I use it as a resource development, teaching and learning tool the more I realise how I have only ever really scratched the surface. Even amid the excitement around available online applications such as google docs with its frequently identified opportunities for collaborative data handling activity, and open source alternatives such as open office, it still, after all this time manages to throw up surprises, things you wouldn't expect in an application with it's intended commercial audience.

Why is using Excel to create Pictograms so exciting?

The most powerful affordance of Excel, which it shares with other spreadsheets is its "dynamic" aspect, any chart we make is not fixed, but automatically updated if we change data in the cell range that created it. The speed of rerepresentation is one of the key reasons I would choose to use a spreadsheet for data handling activity in the classroom, (that and of course in real life contexts spreadsheets are usually used for this purpose and not generally "data bases.") With the entry of new data, it is possible to observe immediately the effects that this has on the chart we have made. We can change the scale of a chart and observe the effect that this has on the apearance of the data. We can filter and sort data, and discuss the effect this has on the reader's ability to interpret particular types of question, perhaps we might even structure our filters to match criteria we have identified from a question. We can propose models, make predictions and inferences, by asking what would happen if questions, then change the data, (perhaps using formulae to help) and observe the effect in the charts we have made.

A really nice task I did with year five and six students last year involved collecting and logging data about how we used our time over the course of a week. Using formulae in our spreadsheet to help us calculate the amount of time we spent doing particular activities, how many hours a day we spent in total engaged in tasks the idea being to ensure we didn't overspend our 24 hours. This did yield some interesting thinking points for me later about students and multitasking, but that should probably be saved for another time. In addition to standard formulae we also calculated the average (mean) time we spent doing particular tasks, finding modal and median values for tasks to compare directly time spent across the week, before charting these.

If you have used Excel to create charts with students it is more than likely that before you have had time to turn around they have gone on to discover without your help how to recolour the sections of the charts they have made, passed this on to their neighbours and gone on to play with the fill effects tool. It is this tool which is key to making your chart into a pictogram, since here you can import images to chart columns to change their appearence. Eg
  • creating a chart to show the populations of countries,
  • comparing the heights/weights of dionosaurs
  • surveying traffic or modes of transport we used to get to school
we could insert a downloaded image of each nation's flag, the dinosaur or vehicle type as the fill for it's column.

What may be missed in this process however is the key to turning these charts into pictograms, the tick box that enables you to scale the images, and the text box beside it that allows you to decide on the unit each image in the column will represent.

Making a Pictogram with Excel

Creating the chart

  • Input your data to the spreadsheet
  • Select the Cells containing the data you want to use by clicking and dragging to highlight it
  • Click on the chart wizard and work through the process to develop a column or bar chart, adding axis labels, a title, deciding on the numerical range for the y axis and so on.
  • Select where you would like to insert your chart, in the curent page or as a separate sheet.
  • click ok

Editing the bars to add a background image

  • Click once on the bars to select all and then again on the individual bar you want to change
  • Double click to open the colour swatch, and select fill effects
  • Click the picture tab
  • Click select picture and browse to find the image you want to use in your column
  • Click OK

Now if you click OK again the whole image will be stretched to fill the column

Turning Your Bar Chart into a Pictogram

Having followed the process above to insert a stretched image, double clicking and returning to the fill effects dialogue box you will see to the lower right, the "stack and scale to" tick box.

  • click in the "stack and scale to" box
  • Enter a value for the image to represent in the text box below this eg 1 scales the image to represent 1 unit, 2 scales the image to represent 2 units in the chart and so on.
  • Click OK and return to the chart, to see the effect.
Do you want to use your chart as as a Pictogram or a Block Chart?

This affordance of Excel as a tool I think is really useful for helping develop resources to bridge the relationships between chart types. I can make several versions of the same chart, and edit each one to support discussion. Eg
  • A bar chart (with all chart features included, but no scaled images in my columns)
  • A Block chart (with all chart features included, with scaled images in my columns)
  • A Pictogram (with axis scales removed)
With the chart completed I can decide whether I want to keep axes and grids, and if not simply click on and delete chart elements and features I don't want to include.

Pictorial representations must be read, inorder to make meaning from them. Creating charts that include or exclude features allows us to treat them like Mathematical "cloze procedures," that allow inference and engagement with them as meaning making structures.

The nice thing about using a tool like Excel to do this is how we can repeat the chart making process, representing the same data in different ways, and even present the pictogram as a bar chart with complete scales and axes to consolidate the similarities between the chart types. Changing the data in the spreadsheet itself will update all of your representations simultaneously, and save time, in presenting the data for further discussion and review. Adding these as copies, or saving the file as will allow you to keep your original template.

Using these artefacts as tools beyond Excel

When preparing notebooks for the whiteboard, these charts can be selected, copied and pasted directly to the notebook page, and then using hide and reveal techniques focussed discussion can be developed around the charts.

Charts Like these tell "multimodal" mathematical stories. Stories that can be set in a range of cross curricular contexts, and as such these must be explicit through titling and axis labelling primarily. As well as engaging students with the subject matter though it is important to read the scale and legend, to help us to characterise and populate our story. When creating charts to share with students I like to begin discussion with a chart or charts where all written elements have been hidden including scale values.
  • I prepare notebooks using the pen tool and white ink, to cover these.
  • During the lesson or shared task these are gradually removed using the eraser as discussion evolves around the "shared text."
Beginning sessions with charts where no information is visible other than the image representing the data, and asking children to discuss and make suggestions about what story the chart might tell opens up opportunities to evaluate student knowledge and experience around the chart type, as well as to ellicit understanding of how the chart might be used. Asking what other information we might expect to find, and then rubbing to reveal suggestions using the eraser, allows us as a class to gradually build up a picture of the story the chart is telling, before engaging with any interpretation of the representation.

Making Links Between Representations

Starting with the spreadsheet enables multiple representations of the same data to made and edited adding or removing elements to change the form that the representation takes. Inputting new or updated data to the spreadsheet, will dynamically alter the representations made from the range selected allowing comparisons to made as the session progresses. This process is possible with the other tools I explored too when thinking about writing this post, however what made Excel different was the pictogram, none of the other tools I used or had available to me this week allowed this.

As a time saving device this tool has been an exciting find for me, and I hope you find it useful too. Happy playing.

8.4.08

Meme: Passion Quilt

I was tagged by Angela Maiers, a week or so ago to take part in the Passion Quilt Meme. First of all I want to apologise for the time I have taken to respond, but I have struggled a bit with this. I was tempted when I first received Angela's tag to search FlickrStorm for a graphical metaphor or two. However this didn't seem quite right since my "inspirations" usually comes from the students I work with, the experiences they bring to school and share with me. My blog is as much a celebration of their achievements and what I have learned from them, as a place to share and explore my use of ICT in the classroom. Within our PLNs students are key and central players, effecting every decision we make, keeping us on our toes and contributing to, leading and initiating the learning conversations that drive the communal learning experience we share. Student voice is what keeps us in business. Learning is built on common experience and the negotiation of shared meaning.

This image, "I'll be the narrator and you can be baby bear!" represents a key moment from my classroom this year and the role of ICTs in education as I see them their potential and capacity to support, develop and enhance "Learner Lead Learning." Learning to share, engage with and represent our ideas to a global audience must by default expand our view of text and textuality into a multimodal domain. A view of textual engagement and development that sees language alone as the vehicle for communication will not help overcome communication barriers as we strive to achieve this. The promotion and development of Multiple literacies must be a key element in developing communication and designs for learning for the future, and is an underlying theme for much of the work I present and share here. The "C" in ICT represents communication, but can stimulate so much more from its users creativity, community and context among others, my passion is to explore, unpick and engage colleagues and students with the potential that these ideas bring to learning to learn as we develop a pedagogy for the 21st century. A bit grand perhaps, but Passing on...

Here is how the Meme works :

  • Post a picture from a source like Flickr Creative Commons or make/take your own that captures what you are most passionate about for kids to learn…and give your picture a short title.
  • Title your blog post “Meme: Passion Quilt” and link back to this blog entry.
  • Include links to 5 folks in your professional learning network or whom you follow on Twitter/Pownce.
I now pass on the torch to Linda, Anthony, Nicholas, Tricia and MissTizzy.

3.4.08

Bristol Past and Present

Have just discovered this fabulous web based resource " The Changing Face of Bristol England and It's People."

This image from the site and acredited to Paul Townsend, is part of a vast collection of images both on the site and in the Site's Google Earth Geotagged Set. However watch carefully because there is more to it than meets the eye, once on the site follow the Bristol Then and Now link for further examples.

I like the idea of Geotagging Historical images, it gives them a presence and point of reference in the here and now. Perhaps even more powerful for me in this site though is the use of image swapping through animation, allowing direct visual comparison between street scenes in the past and images captured at the same location more recently.

I have pondered a number of times on how cool it would be, to enable use of old photographs with students in this way, using digital cameras to frame shots as they engaged in a kind of historical orienteering activity, collecting images on trails perhaps before using other digital tools to morph between one their modern image and the old photo they had been given as a reference point.

In our modern cityscapes, with potential access to mobile technologies and GPS this strikes me as an increasingly practical possibility. Paul's site provides some interesting models to use and share when I next set out to explore this with colleagues.

It also represents a fantastic visual history resource for the people of Bristol. Thank you.

Historyman's geotagged collection of Memories of Bristol, can be found on Panoramio.

Adendum Pictorial tours of the city from About Bristol

29.3.08

Making a Layered Text With 2 Create

In my last post I mentioned using 2 create to develop homemade layered texts, that work in a similar way to those developed by the Hamilton Trust. With a Year 4 class I originally used Powerpoint to do this, while working on our theme around the Romans in Britain. As a class we developed a paired collaborative writing project based on the life of a slave boy called Victor and used this to frame a "really long historical story."

We used available non fiction texts and Scheme materials including secondary and primary source material to support the information gathering process, and began exploring through the use of images, talk for writing and role play, how it might have been to be a slave of Victor's age. From the information we had available, comparing this with our own lives as we tried to develop empathy with our central character. The text presented in the flash presentation below was developed over the course of our writing unit, during guided and modelled composition activities. It was originally part of a PowerPoint story, including hyperlinks to lead us off to the stop and think areas, that were developed, we hoped, to engage our readers with the story in a different way. Adding depth to the engagement our readers would have, by asking them to explore aspects of the story we had written more deeply, and doing things in response to our writing.


Using 2Create to Add a New Dimension to an Existing Idea

This morning I have been playing with 2create, by 2 simple, and as I mentioned in my previous post, this tool has the ability to export, what is in this case a mirror of the powerpoint show we originally created as a class, in a flash format. To create the basis of this presentation, I opened 2 create and inserting the same number of slides as I had in the original PowerPoint show. Toggling between PowerPoint and 2Create I copied the content of each slide from PowerPoint to its corresponding slide in 2Create.


Bringing the Show To Life


Adding Common Navigation Structures to the Show

With the content in place, I then added a series of common buttons for navigation.

  • A back button - to take us to the previous slide
  • A next button - to take us to the next slide in the story
  • A home button - the house, to return us to the first slide in the show
  • A thought bubble button - to take us to one of the stop and think or explore pages.

For ease of development, I made one full set of buttons opn the first page, and then selected, copied and pasted these to each of the slides in my 2create presentation.

It is important to emphasise to students why common navigation structures are neccesary in texts such as this which have strong parallels and models in the web sites we visit. The navigation structures help our readers understand how the text we have and are creating is intended to work. Readers need this in order to help them engage with our work in the way we intended. Good Authors of course take their readers into account when they are writing. Not all student shows need to have the same navigation tools or symbols, but within each show or text the navigation style should be consistent.

Linking the Pages in the show

With the navigation buttons in place, hyperlinks can be added between slides, allowing readers to turn or move from one page to another. In 2create this is done, by

  • Clicking on the button or object we want to use as our link
  • Right clicking to reveal a context menu for that object.
  • Clicking the actions tool,
  • In the "actions" dialogue box. Clicking the "turn page" tab,
  • Selecting from the drop down menu the page we want to link to, before pressing the ok button.

When working with the students on our mapping project they were required to give each page or slide a name, so they could see at a glance where their buttons were leading to. You may find this process useful too if you decide to play with this tool. This process was repeated with each button throughout the show, with buttons not required on certain slides being deleted as I went.

Testing the Show

This may seem obvious but when building or compiling anything with Hyperlinks in I always try them out locally or through preview, to make sure they lead to where I want before I publish. Pressing the green play button in 2 create, compiles a flash file to run in the program, so the look, feel and navigation of the project can be trialled and evaluated before being published. Working on our mapping project the students have been encouraged to engage with this process continuously as their atlases were being developed, it has a kind of a DT feel to it, but in projects such as this we are not just learning ICT skills we are creating content and authoring textual spaces that we want our readers to engage with. There is nothing more frustrating than engaging with an online text and then hitting a dead link. It is advisable therefore to spend time working through the text you have created or encouraging the students to spend time playing in their own texts before publication.

Publishing the Show

Using 2create, the slide show can be saved in the software's native format (.2cr), but also exported as a "Flash File." (.swf). Flash Files, are a web standard format, many of the websites we visit everyday use flash, BBC Bitesize interactivities are flash files, and the navigation panel in "Espresso" for example is flash based. Flash files can be added to the school website, and as you can see here to a blog so visitors can engage interactively with the work we or our students have developed through 2create. In order to have the file run, it must be uploaded to a web host in the first instance, this file has been uploaded to the file storage space on my web site and then linked to the blog through a piece of code I borrowed from "Flash For Blogger -Dummies Guide."

The SmartBoard's Notebook, is also enabled to allow the inclusion and use of flash based interactivities. So the files developed in 2create can become additional multimodal resources for use on the IWB.

Slideshow Credits: Original Story by SMills and Y4 (2004) Teyfant Community School, Redeveloped by SMills in 2create 2008