For a while now one of my colleagues has been producing video files to support student revision and publishing these to his own You Tube Channel.
The videos feature modeled examples of working past GCSE papers and questions. This post is an opportunity to celebrate his work and to encourage visitors to check out the materials he has developed. Rob's Videos can be found by following this link. I hope you find them useful.
Showing posts with label Mathematics. Show all posts
Showing posts with label Mathematics. Show all posts
6.2.13


24.7.11
Google Forms, Calc, Bar Charts and Excel: Data Handling Gets Creative
In the process of doing housekeeping on the PC and at my blog, I have come across a number of partially completed posts waiting for an audience. So to work, this post outlines a series of activities I used with students in Phase 2 while introducing Spreadsheets for data handling last April.
Communal Data Collection Using Google Docs
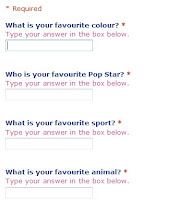 The unit began in class using our Asus netbooks and a Google form I had prepared entitled " A Few of Our Favourite Things." The form was set up as an online questionaire, with free entry text boxes. The students accessed the web and followed a prepared link from the VLE to the data entry form. In pairs the students were encouraged to talk about and then respond individually to a collection of questions around the subject of our favourite things, such as what is your favourite colour/song/football team/subject at school? Completing the form and pressing submit, automatically updated a Google spreadsheet, that was displayed on screen. The live data collection was a real draw, as they watched each other's data arrive and the spreadsheet update in real time. Pace in this part of the session was generated by the sense of urgency to submit their information and see it appear before others. We knew how many students were in class, and so the size of the sample we expected to see. We could check quickly that everyone had submitted their data by counting the number of rows completed, before closing the "poll" and exporting the data sheets for use table top based activities. When all the data was in the spreadsheet was exported and saved as a pdf file, this was then printed and distributed to groups of students to use as the basis for tallying and data entry.
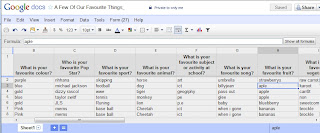 As a primary teacher, I am familiar with the amount of time that can be taken up with student data collection, as individual students navigate the room, collecting responses by tally. I like the idea that using this method a range of data was collected relatively quickly, and as a communal act was then available to all following submission. One of our key questions before engaging with our data sets, must be has everyone responded. Placing the google spreadsheet centrally to the IWB, the students could see the sheet being updated as data came in, since the form had been set up so all fields were compulsory, no one could submit until they had completed each field, and then simply counting or tallying the number of respondants visible we could identify who we were waiting for. Having a range of data available allowed us to use real information in our initial skills teaching activities, and then for students themselves to select from data sets they were interested in to develop their own individual data sets for further exploration.
Rerepresenting our Samples as Frequency Tables
With the downloaded "spreadsheets" distributed to pairs of students, we worked together on our Netbooks as I modelled, using a projected image of the screen how to create a frequence table using Open Office's Calc spreadsheet. We did this using the same data set.... Our Favourite colours. The students were shown how to enter text labels in one column, elimnating duplicates as they went, before in the parallel column counting/tallying and recording the frequency of voters for each colour. These tables were then given a group constructed title, and the cells into which data had been entered were adjsuted for fit, and then formatted with borders. Each student pair then saved their file.
Next the students were asked to choose two data sets from those on the spreadsheet printout and to create frequency tables for these independently, saving their work periodically so the data would not be lost.
From Frequency Tables to Pictorial Representation
With our data enterd to the Spreadsheet and the tables formatted, we moved on together using the data set we had set up together as our starting point. Using the chart wizard students were guided through the creation of a bar chart. As we worked students discussed and were encouraged to add appropriate chart titles, and also axis labels. We identified which axis was the x and which the y, we discussed what was special about the data represented on these, and appropriate titles and labels for them. The students were also, shown how to change formatting and how to recolour the columns and bars in the chart.
Students were then left to practice this process creating a set of bar charts for each of the three other data sets they had created.
This process took approximately 3 sessions of an hour each. Once completed files and charts were upoaded to the VLE, from where they could be accessed for printing out and display.
Moving On: Presenting Pictograms in a Garden
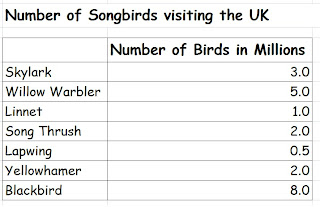 In class the students had been introduced to Calc and Google Spreadsheets, and they had experienced using these tools as part of a collaborative task, to input and collect data remotely and to tally, enter, present and rerepresent data locally. In the final stage of this project however I wanted the students to get creative, considering other elements in chart creation with a spreadsheet environment, that might make our maths more appealing interesting and accessible to a reader. To do this I used another prepared data set, but this time based on a set of survey data I had available to me around songbird populations in the UK. For this series of activities the students were given access to Excel, rather than calc which they had been using on the netbook. We began the session by discussing Excel and comparing it to the other tools they had used. What did they notice about the environment? What was the same about it and what was different? For all intents and purposes the tools were largely the same, they were visually a grid, made up of cells arranged in rows and columns. We formatted the cells, rows and columns in a very similar way. With these identified, the students were then provided with data sets to enter, and format as before. We identified the chart wizard tool, and then set to work creating charts based on the data, adding appropriate axis labels and a clear title, with the students recolouring and reformatting the chart.
The students were then asked about the data itself. How many of these birds had they ever seen? Where would they expect to see them? Did the students think it would be possible to create a bar chart that would really draw in their audience, or even wow passers by as they were working? Could we create a chart that included images of the birds, and set the birds in their natural habitats. Viewing charts as part of the Multimodal world this would add an additional layer of meaning making to the outcomes.
The students were now engaged in a collect and store task, using an image search to locate individual images of each of the birds in question and one final image of a garden.... A bar chart in a garden...
The students were then encouraged to further explore the formatting tools for their charts, and to apply the skills tha already had from work with Calc. We made a second version and this time instead of colour formatting bars, used the fill effects button and picture tab to insert individual bird images to our chart columns. These were then scaled by 1, to create a pictogram type effect. Highlighting the chart area the garden image they had found was then applied as a background to the chart plot area itself. Very pretty. However with the images inserted the axis labels and values as well as the chart title were less readable, requiring some further formatting effects to be applied, changing font colours and backrounds became a necessity to make them readable.
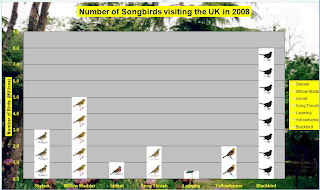 The outcomes are very attractive, as well as introducing for me a key aspect to the purpose of data handling the idea that we produce charts and graphs to be read and interpretted. Like other visual text sources, they are created to help an audience access and interpret them, the more relavant our content to context the more likely we are to portray the meaning we set out to share. Persuading students to use formatting devices for other reasons than because we can, is a key aspect to helping them understand the roll of such devices, and ICTs offer incredibly powerful and creative ways to do this. In this unit I wanted students to engage with Spreadsheets as a mathematical tool, not only for its pace and dynamic nature in presenting and representing information, but also as a way of managing the process and engaging with charts and graphs as a form of visual literacy.
Communal Data Collection Using Google Docs
 The unit began in class using our Asus netbooks and a Google form I had prepared entitled " A Few of Our Favourite Things." The form was set up as an online questionaire, with free entry text boxes. The students accessed the web and followed a prepared link from the VLE to the data entry form. In pairs the students were encouraged to talk about and then respond individually to a collection of questions around the subject of our favourite things, such as what is your favourite colour/song/football team/subject at school? Completing the form and pressing submit, automatically updated a Google spreadsheet, that was displayed on screen. The live data collection was a real draw, as they watched each other's data arrive and the spreadsheet update in real time. Pace in this part of the session was generated by the sense of urgency to submit their information and see it appear before others. We knew how many students were in class, and so the size of the sample we expected to see. We could check quickly that everyone had submitted their data by counting the number of rows completed, before closing the "poll" and exporting the data sheets for use table top based activities. When all the data was in the spreadsheet was exported and saved as a pdf file, this was then printed and distributed to groups of students to use as the basis for tallying and data entry.
 As a primary teacher, I am familiar with the amount of time that can be taken up with student data collection, as individual students navigate the room, collecting responses by tally. I like the idea that using this method a range of data was collected relatively quickly, and as a communal act was then available to all following submission. One of our key questions before engaging with our data sets, must be has everyone responded. Placing the google spreadsheet centrally to the IWB, the students could see the sheet being updated as data came in, since the form had been set up so all fields were compulsory, no one could submit until they had completed each field, and then simply counting or tallying the number of respondants visible we could identify who we were waiting for. Having a range of data available allowed us to use real information in our initial skills teaching activities, and then for students themselves to select from data sets they were interested in to develop their own individual data sets for further exploration.
Rerepresenting our Samples as Frequency Tables
With the downloaded "spreadsheets" distributed to pairs of students, we worked together on our Netbooks as I modelled, using a projected image of the screen how to create a frequence table using Open Office's Calc spreadsheet. We did this using the same data set.... Our Favourite colours. The students were shown how to enter text labels in one column, elimnating duplicates as they went, before in the parallel column counting/tallying and recording the frequency of voters for each colour. These tables were then given a group constructed title, and the cells into which data had been entered were adjsuted for fit, and then formatted with borders. Each student pair then saved their file.
Next the students were asked to choose two data sets from those on the spreadsheet printout and to create frequency tables for these independently, saving their work periodically so the data would not be lost.
From Frequency Tables to Pictorial Representation
With our data enterd to the Spreadsheet and the tables formatted, we moved on together using the data set we had set up together as our starting point. Using the chart wizard students were guided through the creation of a bar chart. As we worked students discussed and were encouraged to add appropriate chart titles, and also axis labels. We identified which axis was the x and which the y, we discussed what was special about the data represented on these, and appropriate titles and labels for them. The students were also, shown how to change formatting and how to recolour the columns and bars in the chart.
Students were then left to practice this process creating a set of bar charts for each of the three other data sets they had created.
- Applying really clear and thorough titles for their charts that would help their readers.
- Producing Axis Labels that would inform their readers of exactly what was shown there
- Recolouring the data plots and bars, choosing appropriate colour fills and effects to match the data.
This process took approximately 3 sessions of an hour each. Once completed files and charts were upoaded to the VLE, from where they could be accessed for printing out and display.
Moving On: Presenting Pictograms in a Garden
 In class the students had been introduced to Calc and Google Spreadsheets, and they had experienced using these tools as part of a collaborative task, to input and collect data remotely and to tally, enter, present and rerepresent data locally. In the final stage of this project however I wanted the students to get creative, considering other elements in chart creation with a spreadsheet environment, that might make our maths more appealing interesting and accessible to a reader. To do this I used another prepared data set, but this time based on a set of survey data I had available to me around songbird populations in the UK. For this series of activities the students were given access to Excel, rather than calc which they had been using on the netbook. We began the session by discussing Excel and comparing it to the other tools they had used. What did they notice about the environment? What was the same about it and what was different? For all intents and purposes the tools were largely the same, they were visually a grid, made up of cells arranged in rows and columns. We formatted the cells, rows and columns in a very similar way. With these identified, the students were then provided with data sets to enter, and format as before. We identified the chart wizard tool, and then set to work creating charts based on the data, adding appropriate axis labels and a clear title, with the students recolouring and reformatting the chart.
The students were then asked about the data itself. How many of these birds had they ever seen? Where would they expect to see them? Did the students think it would be possible to create a bar chart that would really draw in their audience, or even wow passers by as they were working? Could we create a chart that included images of the birds, and set the birds in their natural habitats. Viewing charts as part of the Multimodal world this would add an additional layer of meaning making to the outcomes.
The students were now engaged in a collect and store task, using an image search to locate individual images of each of the birds in question and one final image of a garden.... A bar chart in a garden...
The students were then encouraged to further explore the formatting tools for their charts, and to apply the skills tha already had from work with Calc. We made a second version and this time instead of colour formatting bars, used the fill effects button and picture tab to insert individual bird images to our chart columns. These were then scaled by 1, to create a pictogram type effect. Highlighting the chart area the garden image they had found was then applied as a background to the chart plot area itself. Very pretty. However with the images inserted the axis labels and values as well as the chart title were less readable, requiring some further formatting effects to be applied, changing font colours and backrounds became a necessity to make them readable.
 The outcomes are very attractive, as well as introducing for me a key aspect to the purpose of data handling the idea that we produce charts and graphs to be read and interpretted. Like other visual text sources, they are created to help an audience access and interpret them, the more relavant our content to context the more likely we are to portray the meaning we set out to share. Persuading students to use formatting devices for other reasons than because we can, is a key aspect to helping them understand the roll of such devices, and ICTs offer incredibly powerful and creative ways to do this. In this unit I wanted students to engage with Spreadsheets as a mathematical tool, not only for its pace and dynamic nature in presenting and representing information, but also as a way of managing the process and engaging with charts and graphs as a form of visual literacy.
28.5.10
Patterning With LOGO


In previous posts I have explored the use of MSWLOGO a freeware tool and MS Paint within the context of the Mathematics classroom, developing ideas around the properties of shape, rotational symmetry and patterning, but using this image as a starting point and available design for the journey, what would happen if... this was extended to explore tessellation and repeated patterning, using copy and paste processes?
Image Credit: Hazrat Ali Mosque, Afghanistan National Geographic Photo of the Day 06/05/10
1.4.09
Tracking a Learning Story: Using Powerpoint and Slideshare as Digital Floor Books
Perhaps I should now entitle this post "Tricked into a learning story." I was amazed today when I visited my Slideshare space to find one of the Powerpoint files I uploaded a while back had been viewed 100504 times.
I don't usually quote my site stats, this space for me is not about that, it is a place where I reflect and share the work I do with my students and ideas that inspire me as a result. However I recieved an email from slideshare a site I trusted as a member and set off to see what it was all about. I was really excited as you may imagine by what I saw when I visited my slidespace having not visited for a while. I didn't expect a service like this to play about with my stats, and certainly not in a public facing space. I put together the original post and published a link on twitter to celebrate. As it turns out I have been well and truly had by what has turned out to be their april fool. Thanks to members of my Twitter network, and especially NeilAdam, I found out about this, and am feeling suitably foolish as a result.... Well done slideshare!
Now feeling marginally calmer about it I have decided I should take the "prank" as a dose of medicine to remind myself of all the esafety lessons I have taught my students. Now however it seems I have to add to these sessions, that even the sites you think you can trust may not be what they say they are. I can take a joke as well as the next, but am seriously unhappy about how this has turned out, and with the availabilty of my own hosting space am now intending to move my files as a result.
Originally the show in question was created as a "digital floorbook" as part of an MSc Assignment on the potential of ICT in assessment for learning. It follows through and tracks a teaching sequence, using IWB notes and photographs as evidence, in a planned process to move my students toward the formal algorithms for addition and subtraction, drawing on and evaluating the range of mental methods and informal jottings they were using at the time.
This "floor book" has been shared a number of times, and featured in a previous post. It is now buried away but so this post does not become an entirely wasted space I am embedding it again in the hope that you may find it useful.
Thanks to everyone who really has viewed or downloaded the show, however many of you there are. Maybe Slideshare will be able to give me a more accurate view on this soon!
I don't usually quote my site stats, this space for me is not about that, it is a place where I reflect and share the work I do with my students and ideas that inspire me as a result. However I recieved an email from slideshare a site I trusted as a member and set off to see what it was all about. I was really excited as you may imagine by what I saw when I visited my slidespace having not visited for a while. I didn't expect a service like this to play about with my stats, and certainly not in a public facing space. I put together the original post and published a link on twitter to celebrate. As it turns out I have been well and truly had by what has turned out to be their april fool. Thanks to members of my Twitter network, and especially NeilAdam, I found out about this, and am feeling suitably foolish as a result.... Well done slideshare!
Now feeling marginally calmer about it I have decided I should take the "prank" as a dose of medicine to remind myself of all the esafety lessons I have taught my students. Now however it seems I have to add to these sessions, that even the sites you think you can trust may not be what they say they are. I can take a joke as well as the next, but am seriously unhappy about how this has turned out, and with the availabilty of my own hosting space am now intending to move my files as a result.
Originally the show in question was created as a "digital floorbook" as part of an MSc Assignment on the potential of ICT in assessment for learning. It follows through and tracks a teaching sequence, using IWB notes and photographs as evidence, in a planned process to move my students toward the formal algorithms for addition and subtraction, drawing on and evaluating the range of mental methods and informal jottings they were using at the time.
Using mental methods to construct a standard written method for addition and subtraction
View more presentations from twowhizzy.
This "floor book" has been shared a number of times, and featured in a previous post. It is now buried away but so this post does not become an entirely wasted space I am embedding it again in the hope that you may find it useful.
Thanks to everyone who really has viewed or downloaded the show, however many of you there are. Maybe Slideshare will be able to give me a more accurate view on this soon!
15.7.08
Catapult Chicken And Talking For Reasoning
 I was playing on the iboard site tonight and came across this brilliant activity in the maths trial Pack. First of all the name appealed, but then came the visuals. Picture three chickens, a stack of weights and a catapult! What to do? What to do? A serious Homer Moment arose, but with an inevitable outcome. As I expect any self respecting student would do, I put as many weights as possible on the trap door, loosed these on the catapult and then sat back as each chicken was thrust skyward beyond their roosts before, slowly drifting back to mother earth assisted by a parachute.
Putting aside for a moment the humour and obvious fun I had, my initial free and semi structured play engaged me in a series of trial and refinement processes, as I visually evaluated the effect that the simulated masses had on the catapult and its aility to raise the chickens to their roosts. Further play and I found myself estimating what masses would be needed to lift each of the three different chickens to various levels on the tree and this in itself became a bit of an art.
Devised as a tool to support problem solving in context with year 1 students (5-6yrs), "Catapult Chicken" is part of iBoard's developing tool kit to support the Primary Mathematics Framework in Foundation and Key Satge One. As with other tools developed by the team, beyond its surface entertainment value is a well thought out in, to solving problems with inbuilt space for teacher and student creativity, and oppportunities to extend the face value tasks through "talk for reasoning" and estimation.
- How could we arange the chickens largest to smallest, in the branches?
- How could we do this from top to bottom, or bottom to top?
- How many weights might we need to boost the largest chilcken up to the middle branch?
- What would need to happen if...? we wanted to get the large chicken to the top branch?
- Can we order the chickens largest to smallest, bottom to top?
The activity besides being really good fun, would work realy well with students working in pairs or individually during "give and go" main sessions interspersed with mini plenaries that followed on from free play. Here the children could also discuss and devise problems and challenges for the class to work on, with students sharing solutions on the IWB and explaining processes or giving reasons for their choices. I can also imagine some of the students in my current maths group enjoying the use of this tool to support modelled reasoning and estimation tasks in plenary sessions or as an introductory thinking activity and starting point for a puzzles and problems sessions. The environment I would suggest is one that in developing inclusion strategies, and thinking about what the learner needs is as applicable to the stage of development as it is to age. Perhaps I am only 7 at heart rather than a multiple of... but I loved it!
14.6.08
Softease Branch, Y3 and the Properties of Shape
As we aproach the end of term and the end of another school year, I am in the process of what might be called mopping up, looking at areas from the Mathematics framework that we have either not yet engaged with, or which the students have found tricky. Alongside this are some ICT curricular elements that I have not fully developed with the students. We have used data handling environments to for example present data from Science Experiments and as teaching aids with the IWB, but the children themselves have had limited independent access to the tools, other than in small groups at classroom based PCs.
This week we have been involved as a class in a Using and Aplying Mathematics unit, to consolidate our use of vocabulary relating to the properties of 2d shape. At the same time I wanted to embed and develop key skills from the ICT curriculum through the use of a Branching data base. The tool I chose to use for this series of tasks comes from Softease Studio, and is called Branch.
 The sessions began however, not with Branch, but with a drag and drop sorting tool I had made using Smart Notebook. Other whiteboard users could make something similar, and an image of the tool is presented to the left for reference. The key to making and using Branching Data bases, binary trees or "dichotomous keys" is an ability to generate, ask and use "null" questions to divide a set of objects into two sets initially, gradually refining questions to distill the set until the branches at the end of the tree have only one object. This involves asking questions that have "yes or no" answers. This is process I have found easiest to develop using the observable features and properties of sets or collections of familiar objects. We often use Carrol Diagrams and Venn diagrams to do this, and the whiteboard tool I used as an introductory frame to support student and teacher discussion around this process before engaging with Branch itself, was designed to act as a link between these tools.
Since our task had a mathematical focus, we began with the shapes to the left of the book engaging the children in paired discussions around questions such as
"It has four sides and four corners, all of the corners are right angles."
A great set of reponses describing the properties of a rectangle, however in our set we had two rectangles, a square and an oblong. Developing this we began to use the sorting tree model above dragging the two rectangles to the top of the simple tree, and asking the students to propose questions that focussed how they were different. Is it a rectangle ? Or does it have right angles? don't work since both shapes have right angles and by defintition are both rectangles. Are all the sides the same length? Provides a yes or no answer and allows the two shape to be separated.
 We used the notebook to practice this idea together, comparing a number of shapes from our collection and then, testing our questions to see if they worked. The children were then introduced to branch and starting with only two shapes each time initially were were encouraged to make a series of trees practicing and rehearsing their questions together.
 During follow up sessions the idea of working with 4 shapes was introduced and the children challenged to devise questions that would begin by dividing their shapes into two equal sets. This sounds easier than it is. Eg I have a square, an oblong a triangle and a pentagon. A good starting question might be does the shape have right angles? Does the shape have 4 sides? And because of our previous activity the children suggested these? From here the next question was also fairly straightforward for them based on the practice sessions of small trees the day before. However what happens if we drag a circle, a triangle, a square and a pentagon into the tree? Is it curved? Does it have three sides? Although having yes or no answers don't work in relation to the challenge question set at the beginning of the session. What is needed is to ask a question such as does the shape have "more" or "less" than x numbber of sides/corners/angles? The students were then encouraged to use Branch to explore these ideas, Before during our final session requiring the children to begin with 8 given shapes to design a game for their friends to play and test out.
The children really enjoyed this series of tasks, which challenged their thinking and enabled them through paired discussion to use and apply vocabulary developed in previous classroom based sessions to a decision making process. The UK Primary Mathematics Framework says students in the course of their work should
This week we have been involved as a class in a Using and Aplying Mathematics unit, to consolidate our use of vocabulary relating to the properties of 2d shape. At the same time I wanted to embed and develop key skills from the ICT curriculum through the use of a Branching data base. The tool I chose to use for this series of tasks comes from Softease Studio, and is called Branch.
 The sessions began however, not with Branch, but with a drag and drop sorting tool I had made using Smart Notebook. Other whiteboard users could make something similar, and an image of the tool is presented to the left for reference. The key to making and using Branching Data bases, binary trees or "dichotomous keys" is an ability to generate, ask and use "null" questions to divide a set of objects into two sets initially, gradually refining questions to distill the set until the branches at the end of the tree have only one object. This involves asking questions that have "yes or no" answers. This is process I have found easiest to develop using the observable features and properties of sets or collections of familiar objects. We often use Carrol Diagrams and Venn diagrams to do this, and the whiteboard tool I used as an introductory frame to support student and teacher discussion around this process before engaging with Branch itself, was designed to act as a link between these tools.
Since our task had a mathematical focus, we began with the shapes to the left of the book engaging the children in paired discussions around questions such as
- What can you see?
- What is Special about this shape?
- How is this shape different to or the same as this shape?
"It has four sides and four corners, all of the corners are right angles."
A great set of reponses describing the properties of a rectangle, however in our set we had two rectangles, a square and an oblong. Developing this we began to use the sorting tree model above dragging the two rectangles to the top of the simple tree, and asking the students to propose questions that focussed how they were different. Is it a rectangle ? Or does it have right angles? don't work since both shapes have right angles and by defintition are both rectangles. Are all the sides the same length? Provides a yes or no answer and allows the two shape to be separated.
 We used the notebook to practice this idea together, comparing a number of shapes from our collection and then, testing our questions to see if they worked. The children were then introduced to branch and starting with only two shapes each time initially were were encouraged to make a series of trees practicing and rehearsing their questions together.
 During follow up sessions the idea of working with 4 shapes was introduced and the children challenged to devise questions that would begin by dividing their shapes into two equal sets. This sounds easier than it is. Eg I have a square, an oblong a triangle and a pentagon. A good starting question might be does the shape have right angles? Does the shape have 4 sides? And because of our previous activity the children suggested these? From here the next question was also fairly straightforward for them based on the practice sessions of small trees the day before. However what happens if we drag a circle, a triangle, a square and a pentagon into the tree? Is it curved? Does it have three sides? Although having yes or no answers don't work in relation to the challenge question set at the beginning of the session. What is needed is to ask a question such as does the shape have "more" or "less" than x numbber of sides/corners/angles? The students were then encouraged to use Branch to explore these ideas, Before during our final session requiring the children to begin with 8 given shapes to design a game for their friends to play and test out.
The children really enjoyed this series of tasks, which challenged their thinking and enabled them through paired discussion to use and apply vocabulary developed in previous classroom based sessions to a decision making process. The UK Primary Mathematics Framework says students in the course of their work should
- Follow a line of enquiry by deciding what information is important; make and use lists, tables and graphs to organise and interpret the information
- Describe and explain methods, choices and solutions to puzzles and problems, orally and in writing, using pictures and diagrams
- Use Venn diagrams or Carroll diagrams to sort data and objects using more than one criterion
- Relate 2-D shapes and 3-D solids to drawings of them; describe, visualise, classify, draw and make the shapes.
27.5.08
From Probot to LOGO: Some previous posts in action
I have put together this photo montage for the time being to share some of the activities my students have engaged in while using Probots and MSWLOGO this term. Even though presented here in an ICT context, references placed towards the end of this post highlight a number of areas from the Primary Framework for Mathematics with which the children engaged, through the using and applying strand, and which draw into focus the cross curricular potential of work such as this to help children make links between areas of learning.
The file is progressive and begins with the children using the probot to create skeletons around which they made and then decorated their own floor compasses. From here working in groups the students used their floor compasses to learn about compass direction, predicting outcomes from given inputs, eg if I am facing east, and make a 1/4 turn east what direction will I be facing? This required them to know and use the numerical values for rotation sizes, or to calculate these using halving and doubling strategies. Within the problems set we also replaced fractions of a turn with the number of degrees, and the directions of a rotation with clockwise/anticlockwise, and right/left. The children went on from this to make up challenge questions for their friends in other groups.
In the next series of activities the children made mazes using strips of paper. Working initially with right angles, some children chose to extend the activity to include 45 degree turns. The children used their knowledge that a Probot step was 1 cm to help them measure the distances the probot would need to move, and estimation to predict and test the size of turn they would need to make at each point in order to navigate the maze. After step by step planning the children were asked to input procedures, that would take the turtle from one end of the maze to the other without stopping.
The final photographs in the series represent a session in the ICT suite where children used MSW LOGO for the first time. The students were given a prepared treasure map which they loaded into the LOGO workspace, before we discussed as a class and decided the route around the island we would take, or the order in which we would visit particular landmarks. Transferring the floor based experiences of the students to the screen was not difficult, and after only a brief introduction to the commands and how these should be input, they worked very successfully and independently, to resolve many of the issues they encountered. In the plenary to this session the children were asked what they would like to do in the next session, and suggested that they would like to have a blank treasure map, that they could add landmarks to themselves, they could then ask their friends to journey around their island following a route they had prepared.
This series of activities, as well as the obvious ICT and Geographical links, offered opportunities for the students to engage practically with the following strands and related objectives from the Primary Framework for Mathematics
Measuring
Many of the activities here are drawn from or build on previous posts that can be found within the control category to the left of the page.
The file is progressive and begins with the children using the probot to create skeletons around which they made and then decorated their own floor compasses. From here working in groups the students used their floor compasses to learn about compass direction, predicting outcomes from given inputs, eg if I am facing east, and make a 1/4 turn east what direction will I be facing? This required them to know and use the numerical values for rotation sizes, or to calculate these using halving and doubling strategies. Within the problems set we also replaced fractions of a turn with the number of degrees, and the directions of a rotation with clockwise/anticlockwise, and right/left. The children went on from this to make up challenge questions for their friends in other groups.
In the next series of activities the children made mazes using strips of paper. Working initially with right angles, some children chose to extend the activity to include 45 degree turns. The children used their knowledge that a Probot step was 1 cm to help them measure the distances the probot would need to move, and estimation to predict and test the size of turn they would need to make at each point in order to navigate the maze. After step by step planning the children were asked to input procedures, that would take the turtle from one end of the maze to the other without stopping.
The final photographs in the series represent a session in the ICT suite where children used MSW LOGO for the first time. The students were given a prepared treasure map which they loaded into the LOGO workspace, before we discussed as a class and decided the route around the island we would take, or the order in which we would visit particular landmarks. Transferring the floor based experiences of the students to the screen was not difficult, and after only a brief introduction to the commands and how these should be input, they worked very successfully and independently, to resolve many of the issues they encountered. In the plenary to this session the children were asked what they would like to do in the next session, and suggested that they would like to have a blank treasure map, that they could add landmarks to themselves, they could then ask their friends to journey around their island following a route they had prepared.
This series of activities, as well as the obvious ICT and Geographical links, offered opportunities for the students to engage practically with the following strands and related objectives from the Primary Framework for Mathematics
Measuring
- Know the relationships between.., metres and centimetres..., choose and use appropriate units to estimate, measure and record measurements
- Read, to the nearest division and half-division, scales that are numbered or partially numbered; use the information to measure and draw to a suitable degree of accuracy
- Read and record the vocabulary of position, direction and movement, using the four compass directions to describe movement about a grid
- Use a set-square to draw right angles and to identify right angles in 2-D shapes; compare angles with a right angle; recognise that a straight line is equivalent to two right angles
- Read and write proper fractions, interpreting the denominator as the parts of a whole and the numerator as the number of parts; identify and estimate fractions of shapes;
Many of the activities here are drawn from or build on previous posts that can be found within the control category to the left of the page.
16.4.08
Making Dynamic and Interactive Pictograms With MS Excel
 I've had a spot of Blogger's Block lately, but thought I'd try to get back into writing by asking what you think of my Pictogram? Cool huh! Inspired by a Twitter thread this week I thought I'd share the process I used to make it and a few thoughts about why this simple technique excited me so much when I discovered it accidentally and in true "IKEA man" style a while back.
I have used Excel with Key Stage 2 children to support data handling activity for a long time now. It was originally part of our BEON Project toolkit back in the 90's, but the more I use it as a resource development, teaching and learning tool the more I realise how I have only ever really scratched the surface. Even amid the excitement around available online applications such as google docs with its frequently identified opportunities for collaborative data handling activity, and open source alternatives such as open office, it still, after all this time manages to throw up surprises, things you wouldn't expect in an application with it's intended commercial audience.
Why is using Excel to create Pictograms so exciting?
The most powerful affordance of Excel, which it shares with other spreadsheets is its "dynamic" aspect, any chart we make is not fixed, but automatically updated if we change data in the cell range that created it. The speed of rerepresentation is one of the key reasons I would choose to use a spreadsheet for data handling activity in the classroom, (that and of course in real life contexts spreadsheets are usually used for this purpose and not generally "data bases.") With the entry of new data, it is possible to observe immediately the effects that this has on the chart we have made. We can change the scale of a chart and observe the effect that this has on the apearance of the data. We can filter and sort data, and discuss the effect this has on the reader's ability to interpret particular types of question, perhaps we might even structure our filters to match criteria we have identified from a question. We can propose models, make predictions and inferences, by asking what would happen if questions, then change the data, (perhaps using formulae to help) and observe the effect in the charts we have made.
A really nice task I did with year five and six students last year involved collecting and logging data about how we used our time over the course of a week. Using formulae in our spreadsheet to help us calculate the amount of time we spent doing particular activities, how many hours a day we spent in total engaged in tasks the idea being to ensure we didn't overspend our 24 hours. This did yield some interesting thinking points for me later about students and multitasking, but that should probably be saved for another time. In addition to standard formulae we also calculated the average (mean) time we spent doing particular tasks, finding modal and median values for tasks to compare directly time spent across the week, before charting these.
If you have used Excel to create charts with students it is more than likely that before you have had time to turn around they have gone on to discover without your help how to recolour the sections of the charts they have made, passed this on to their neighbours and gone on to play with the fill effects tool. It is this tool which is key to making your chart into a pictogram, since here you can import images to chart columns to change their appearence. Eg
- creating a chart to show the populations of countries,
- comparing the heights/weights of dionosaurs
- surveying traffic or modes of transport we used to get to school
What may be missed in this process however is the key to turning these charts into pictograms, the tick box that enables you to scale the images, and the text box beside it that allows you to decide on the unit each image in the column will represent.
Making a Pictogram with Excel
Creating the chart
- Input your data to the spreadsheet
- Select the Cells containing the data you want to use by clicking and dragging to highlight it
- Click on the chart wizard and work through the process to develop a column or bar chart, adding axis labels, a title, deciding on the numerical range for the y axis and so on.
- Select where you would like to insert your chart, in the curent page or as a separate sheet.
- click ok
Editing the bars to add a background image
- Click once on the bars to select all and then again on the individual bar you want to change
- Double click to open the colour swatch, and select fill effects
- Click the picture tab
- Click select picture and browse to find the image you want to use in your column
- Click OK
Now if you click OK again the whole image will be stretched to fill the column
Turning Your Bar Chart into a Pictogram
Having followed the process above to insert a stretched image, double clicking and returning to the fill effects dialogue box you will see to the lower right, the "stack and scale to" tick box.
- click in the "stack and scale to" box
- Enter a value for the image to represent in the text box below this eg 1 scales the image to represent 1 unit, 2 scales the image to represent 2 units in the chart and so on.
- Click OK and return to the chart, to see the effect.
This affordance of Excel as a tool I think is really useful for helping develop resources to bridge the relationships between chart types. I can make several versions of the same chart, and edit each one to support discussion. Eg
- A bar chart (with all chart features included, but no scaled images in my columns)
- A Block chart (with all chart features included, with scaled images in my columns)
- A Pictogram (with axis scales removed)
Pictorial representations must be read, inorder to make meaning from them. Creating charts that include or exclude features allows us to treat them like Mathematical "cloze procedures," that allow inference and engagement with them as meaning making structures.
The nice thing about using a tool like Excel to do this is how we can repeat the chart making process, representing the same data in different ways, and even present the pictogram as a bar chart with complete scales and axes to consolidate the similarities between the chart types. Changing the data in the spreadsheet itself will update all of your representations simultaneously, and save time, in presenting the data for further discussion and review. Adding these as copies, or saving the file as will allow you to keep your original template.
Using these artefacts as tools beyond Excel
When preparing notebooks for the whiteboard, these charts can be selected, copied and pasted directly to the notebook page, and then using hide and reveal techniques focussed discussion can be developed around the charts.
Charts Like these tell "multimodal" mathematical stories. Stories that can be set in a range of cross curricular contexts, and as such these must be explicit through titling and axis labelling primarily. As well as engaging students with the subject matter though it is important to read the scale and legend, to help us to characterise and populate our story. When creating charts to share with students I like to begin discussion with a chart or charts where all written elements have been hidden including scale values.
- I prepare notebooks using the pen tool and white ink, to cover these.
- During the lesson or shared task these are gradually removed using the eraser as discussion evolves around the "shared text."
Making Links Between Representations
Starting with the spreadsheet enables multiple representations of the same data to made and edited adding or removing elements to change the form that the representation takes. Inputting new or updated data to the spreadsheet, will dynamically alter the representations made from the range selected allowing comparisons to made as the session progresses. This process is possible with the other tools I explored too when thinking about writing this post, however what made Excel different was the pictogram, none of the other tools I used or had available to me this week allowed this.
As a time saving device this tool has been an exciting find for me, and I hope you find it useful too. Happy playing.
3.3.08
Measurement and the Probot
 In a recent post I was excited to report that the humble Probot moved 1cm for every unit input, and was keen to take advantage of this as soon as possible with my students during numeracy. Last week we were exploring scales and investigating the relationships between standard units of measure, and this seemed like too good an opportunity to miss.
Over the course of the week our key objective was to be able to read scales to the nearest half division, and since we are Y3 as the week progressed I wanted the students to engage practically with a range of scales. The context chosen was linear measure, where we began practicing our use and appropriate choice of tools and units, Using rulers and tape measures, to estimate
 and measure to the nearest whole and half division, while also considering the relationships between the units.
- How many cm in a metre?
- How many mm in a cm? And so on...
To work with the relationship between metres and cm, we carried out a group challenge to construct a skeleton of one member of each group. The students cut strips of sugar paper to represent two circumferences of the head, the length of the spine, each arm and each leg, the distance around the waist and three different measures around the chest, and across the shoulders. They estimated the length of each before using rulers to measure these in cm. Once the measuring tasks were completed the skeletons were assembled using a stapler. I mention this here because it was a task that really engaged the students, and which they really enjoyed.
 On Friday we were ready to use the Probot. The session began with the students sitting around a large piece of card, a metre rule placed along its length, and the Probot bumper lined up with the start of the scale. The class were reminded of previous work they had done with BeeBots, and asked to identify the differences they could see between this tool and that.
- It was a car not a bee
- It had different buttons
- It had forward and turn buttons, but it had a pad like a phone
The students were asked how they thought I would get it to move and a little time was spent as we discussed and established how we needed to press the direction buttons and then use numbers, rather than previous experiences of repeatedly pressing direction buttons to move the turtle.
The students were then asked to close their eyes, as I input fd 10, and then asked them on pressing go what they thought I had asked the Probot to do? We tested some of their suggestions, before confirming that I had pressed fd 10. What would happen then if I input fd 20, fd 30, could we predict where the Probot would stop. The students were asked to close their eyes again as I input fd 35 and pressed go. What had I input now? How did they know? Gradually we established that 1 Probot step was 1 cm.
Next a pen was put added to the Probot, and the class talked through the inputting of fd 10 rt 90 fd 20. Before the go button was pressed the students were asked to discuss and predict what they thought would happen. We then observed the trail left by the vehicle, and they were quick to recognise the right angle turn, enabling us to establish that this was the 90 (degree) input given with the right command, the 1/4 turn they were familiar with and had used with the BeeBot.
 For the main activity the students were organised into groups. Each group was given a Probot, a collection precut paper strips of different lengths and some measuring tools to choose from. They were challenged to make mazes for each other, that included only right angle turns. Their friends were then to be challenged to use the things we had learned from our carpet time to input accurate instructions to navigate their Probot through the mazes. Throughout the task the students used measuring tools accurately and with purpose, discussed and planned routes applying mathematical vocabulary beginning to predict and using reasoning about the choices they were making. Above all however they really enjoyed themselves.
23.2.08
Goldilocks and the Three Turtles: Sadness Dawns!
 Even though I have been playing with the Probot all week, it never dawned on me to check or measure the size of a Probot Step until this morning. And so needless to say this post probably seems a bit trivial and sad, but do I care... Not a Jot...
This is a bit of a Goldilocks moment, so bear with me.
"A Roamer step was always to large to use when thinking about about standard measuring units (as it needed to be scaled), A LOGO step was too small. But guess what it appears that a Probot Step is just right."
Because...
1 Probot Step = 1 cm
This little nugget/discovery has really excited me because it promises another route into practical and investigational work around shape, space and measure with my ocassionally challenging Numeracy Group.
Goldilocks Image Courtesy of the British Council
Making a Floor Compass With A Probot
Last year when I was working with Y3 we made small hand held cardboard compass models that we could use to help us with our LOGO based map work. This week I am thinking about introducing angle and turn by using the Probot to make floor compasses that students can use with their turtle. This will help introduce and practice using the keypad.
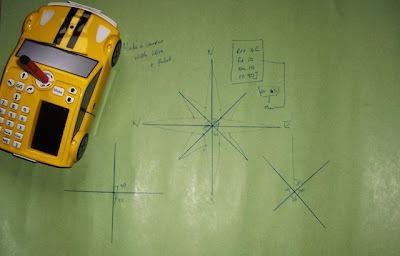 To Make a Compass
Drawing the cardinal points (N,E,S,W)
Place a pen in the pen holder, and the Probot in the centre of a large piece of card, or paper.
input
rpt 4[
fd 20
bk20
rt 90 ]
and press go.
After the Probot finishes, leave it in its end position
Adding The Intercardinal Points (NE, SE, SW, NW)
clear the menu
input rt 45 and press go
clear the menu again then
Input the previous procedure again, but this time substitute 16 for the fd and bk parameters.
ie
repeat 4[
fd 16
bk 16
rt 90 ]
and press go
Turning A Skeleton into a Rose
As a discussion point about the value of the angles between each rotation around the compass I am hoping this will prove invaluable. Eg there are 90 degree turns between each of the cardinal points, 45 degree turns betwen the cardinal and Intercardinal points, while a 90 degree turn or right angle can be made between each Intercardinal Point too. We have explored right angles in numeracy hour, and hopefully the children will recognise these as sketched by the turtle. Using this model the students can mark the turn sizes as well as recording the compass directions. In practical terms I hope the tool will support ongoing work.
I want ultimately the students to design maps and tours using their Probots, and using compass directions to challenge other groups to use their probot in following directions they give. This will later be transferred to onscreen activities using MSW LOGO and imported bitmap treasure maps.
 To Make a Compass
Drawing the cardinal points (N,E,S,W)
Place a pen in the pen holder, and the Probot in the centre of a large piece of card, or paper.
input
rpt 4[
fd 20
bk20
rt 90 ]
and press go.
After the Probot finishes, leave it in its end position
Adding The Intercardinal Points (NE, SE, SW, NW)
clear the menu
input rt 45 and press go
clear the menu again then
Input the previous procedure again, but this time substitute 16 for the fd and bk parameters.
ie
repeat 4[
fd 16
bk 16
rt 90 ]
and press go
Turning A Skeleton into a Rose
- Use a ruler to mark a point 1 cm along each line drawn from the Probot's home position.
- Join each of the cm marks on the Intercardinal directions to the tips of the Cardinal Compass points.
- Join each of the cm marks on the cardinal directions to the tips of the Intercardinal points.
As a discussion point about the value of the angles between each rotation around the compass I am hoping this will prove invaluable. Eg there are 90 degree turns between each of the cardinal points, 45 degree turns betwen the cardinal and Intercardinal points, while a 90 degree turn or right angle can be made between each Intercardinal Point too. We have explored right angles in numeracy hour, and hopefully the children will recognise these as sketched by the turtle. Using this model the students can mark the turn sizes as well as recording the compass directions. In practical terms I hope the tool will support ongoing work.
I want ultimately the students to design maps and tours using their Probots, and using compass directions to challenge other groups to use their probot in following directions they give. This will later be transferred to onscreen activities using MSW LOGO and imported bitmap treasure maps.
18.2.08
MSWLOGO: Creating and Decorating Patterns
 Enjoying half term and the chance to just play. A game of Mountain Hockey this morning, a spot of domestication this afternoon, before playing with MSWLOGO and Microsoft Paint this evening.
Having got my substitution procedure for making a polygon working yesterday, at Andy's suggestion I added another attribute to alter polygon side length so the polygon procedure now looks like this...
to polygon :SIDES :LENGTH
REPEAT :SIDES [FD :LENGTH RT 360/:SIDES]
END
I can now change the type of regular polygon I draw and its side lengths too.
What this means is I no longer need to tell LOGO to draw a particular polygon, However I do need to know its properties, in terms of the number of sides and angles I want it to have, and to decide how large I would like it to be, before I can input these for the turtle to do the hard work of drawing it.
I decided to just play with what I had for the time being and to make a pattern using my polygon procedure and a simple repeat routine, inputting several pentagons that gradually increase in side length before turning through 36 degrees.
Experiences, working with y4 students making "flowers" tell me that this is what they tend to do and get excited by when we explore the environment, having compiled and saved their static polygon procedures, and why not its fun and exciting to see what the turtle draws when he has been programmed.
In this instance the procedure I asked the turtle to carry out looked like this
repeat 10 [polygon 5 50 polygon 5 100 polygon 5 150 polygon 5 200 polygon 5 250 rt 36]
 And this was the resultant pattern.
When the turtle had finished and put his feet up, I saved the workspace as a "bitmap image,"
 and then opened it in Microsoft Paint. Again in work I have carried out with students this is a task they love to do. Using the "fill tools" with the Bitmap created in MSWLOGO, students are able to colour the repeating patterns made, and the design you can see at the top of this post was created in this way.
When I set out to create the pattern, I originally set myself the pattern rule, to use only 2 colours, and fill the design so that no 2 shapes in the pattern that touched or were adjacent to each other would be the same colour. However as I moved outward from the centre of the pattern, I reached a point where it was not possible to follow the rule, so I needed to introduce a third colour.
I am really enjoying this free piece of software and looking forward not only to exploring it further, but looking at how the processes I have missed out on by not engaging more deeply with it, can be applied to my play with the Probot I have brought home with me this week. I am also beginning to reflect on how the use of prewritten procedures might facilitate and support investigational work and consolidation activities in Mathematics sessions around the properties of shape and measure, as well as extension and challenge for more able students in ICT sessions as suggested by previous comments by Andy. Thanks
Investigating a Rectangle with LOGO
This week I will mostly be playing with Probots and the Educational freeware environment MSWLOGO I had installed in school a while back. LOGO is an environment I haven't explored in as much depth as I should have, or so I am beginning to discover, particularly with the increased focus within the New Primary Framework for Mathematics on the using and applying strands.
As I have begun to play with these tools this week, exploring beyond the simple repeat and build procedures I initially work through with students, I am beginning to discover just how superficial my personal understanding and capability with the tool is, and just how big a mistake it was on my part not to persist with the environment in my early teaching career. These short sharp sessions are beginning to challenge me to think more deeply about how I could use tools like LOGO more regularly to challenge and support reasoning and thinking with students during the numeracy hour, a place where I have long believed this aspect of Control and modelling within the primary ICT curriculum should be embedded.
Experience tells me there is a tendency for LOGO to be used and taught in the Primary School these days when the QCA Units for ICT that utilise it make that requirement. This leads generally to control sessions being developed through the delivery of standalone units such as this in Y4. What concerns me about this is not children learning to build procedures that make pretty flower designs, but that from a pedagogical perspective there is much more to LOGO as a learning tool than this. By linking the tool to help develop units of work involving application of knowledge and understanding of shape, space and measure. As a "constructivist" learning tool, LOGO affords opportunities to design learning contexts through which to apply, link and develop strategies for problem solving and investigational work while using the environment to model and explore generalisations and hypotheses.
Thinking about Rectangles
While playing today I have been thinking about rectangles and how, when shown an oblong many of my students are able to identify and describe its basic properties, eg. it is a rectangle, it has four sides, four angles or corners, and each angle is a right angle. When we compare the shape with a square that shares these properties, and the students are asked how they differ? discussions usually begin with how one shape is longer than the other. Further questioning and discussion will lead to us identifying how opposite sides of an oblong are the same length, and how the square is a special (regular) rectangle, but making specific reference to the nature of the opposing sides of an oblong is something which is quickly forgotten.
Coding LOGO to draw an oblong requires us to use and apply this property. Even though the shape has 4 sides, a repeat 4 procedure, would not be an efficient way to input the parameters. Writing even a simple repeat procedure, requires us to think slightly differently about the way we should input our commands in order to draw the oblong. So how might I use LOGO to explore and consolidate understanding about the properties of rectangles as members of the quadrilateral family.
Thinking Through an Investigation
In previous sessions, adapting the QCA Unit linked to above while working with students I have tended to stick to developing regular polygons of a standard side length, returning to making Irregular Rectangles or oblongs later, perhaps if or when students have asked how to do this. This leads to a naturalish discussion about the properties of rectangles.
As said above squares can be classified as Regular Rectangles, as such they have 4 equal sides, 4 equal and identical angles, and the same number of lines of symmetry as they do sides and angles. Each angle is a right angle measuring 90 degrees.
A square can be made with a repeat procedure
repeat 4 [fd X rt 90]
Or using the polygon procedure I published previously, by inputting polygon :side :length.
This would not work for an oblong since adjacent sides are different lengths, while opposite sides are equal.
Building a Procedure to Draw Rectangles
Lets say we wanted the turtle to travel around the perimeter of an oblong 300 units long, we could do this by inputting commands that would draw 2 sides of 100 units and 2 sides of 50 units, using a set of commands that look something like this
fd 100 rt 90 fd 50 rt 90 fd 100 rt 90 fd 50 rt 90
To turn this into a repeat procedure, we could rewrite it something like this:
repeat 2 [fd 100 rt 90 fd 50 rt 90]
So a build command would look something like this...
To rectangle
repeat 2 [fd 100 rt 90 fd 50 rt 90]
end
Saving this procedure, typing in rectangle and hitting the enter key would draw a rectangle where 2 sides were 100 units long and 2 sides were 50 units long.
Building a Procedure to Create Variable Rectangles
The last procedure would be fine if we always wanted to make our rectangle the same shape and size, or we were happy to edit our procedure every time we wanted to change the size of our rectangle. But if we wanted to use our program to help us investigate for example the perimeters of rectangular fields that a farmer could fence with 300 metres of wire? Or the different rectangles we could draw with a particular perimeter it would be useful to have a program where we were able to substitute parameters. (Thanks Andy am having lots of fun with this!) In this case we might use a procedure something like this:
to rectangle :sidea :sideb
repeat 2 [fd :sidea rt 90 fd :sideb rt 90]
end
Investigating Rectangles Maybe!
Now I could begin either inputting side lengths to the procedure to randomly draw different rectangles, or I could begin applying my knowledge and experience about the properties of rectangles, using other areas of mathematical experience such as calcualation, addition and subtraction, halving and doubling etc to help me explore/investigate the substitution values that total a given perimeter, using my procedure to model and test my work by inputting my values and testing on screen. Eg with my length of 300 metres or Turtle units
rectangle 40 110 and hitting the enter key would draw on oblong with this perimeter
40+40+110+110= 300
The procedure models the familiar formula for calculating the perimeter of a rectangle
2l+2w=p
(2x40) + (2x110) = 300
What about rectangle 45 105?
45+45+105+105=300
A suitable problem might be for children to investigate some of the different ways of fencing a rectangular field with 300 metres of wire (using 300 turtle units to represent this).
I don't think I would show the children the procedure and how it works. Instead it might be fun to begin with trial and error processes through the introduction and investigation of a systematic pattern, similar to the example below
40+40+110+110= 300 (rectangle 40 110)
45+45+105+105=300 (rectangle 45 105)
50+50+100+100=300 (rectangle 50 100)
What might the next sequence or input be? What can we see happening in the pattern? What would happen to the pattern if we changed 40 to 41 or 42 and so on? The students could use whiteboards to record their patterns, inputs and informal jottings if necessary, with the focus of the task being around paired discussion, mediated by the onscreen feedback and success of their input in relation to the expected output of a rectangle.
Moving on perhaps we could ask the children to use their experiences to visualise, map out and draw what they think the turtle has to do in creating each of the rectangles they have drawn, focusing their attention to the visible properties of each shape and how these relate to the numerical values they have inputted. Notice the line (perimeter) made by the turtle travels around the shape, so each step carried out must have been in sequence. Even though still focussed on the properties of oblongs and the relative location of their sides, we also have the contingency within this activity to begin to introduce the idea that 2 of the values in each of the patterns are the same, and that as the turtle draws them they output to become opposite sides of the oblong and that adjacent sides are of different lengths. So perhaps at this point we could look at or introduce a simple repeat procedure for drawing a rectangle and explore how each value might be substituted into the program, talking through the effect, drawing and visualising it before returning trying it on screen, perhaps with trace enabled, and finally reviewing our square and oblong, discussing how or if what we have learned during our investigation has changed our view of the two shapes. This might also support introduction of the formula for calculating perimeter of squares and other rectangles, by comparing and deriving the standards from the LOGO procedures.
eg repeat 4 [fd x rt 90]
could be reduced to the perimeter of a square is equal to 4 times the length of 1 side
so p=4xl
repeat 2 [fd x rt 90 fd y rt 90]
could be reduced to the perimeter of a rectangle is equal to 2 times the length add 2 times its width.
so p=2l+2w
Using the rectangle procedure again the task could be extended to enable students to test and investigate the shapes of fields that can be fenced using different lengths of wire by the farmer. What length would each side be if the farmer wanted to make a square field using the length of wire he has?
In class and at table tops, this activity could be further extended to explore the relationship between area and perimeter in each shape, using squared paper to explore the different shaped fields the farmer can make, and the area of each one.
This may seem an ambitious proposal, but I would be fascinated to see just what a KS2 class would make of the activity. I think most of us would be surprised to see just what a Y4 class can learn about the properties of polygons and rotation when using the idea that 360 degrees is the same as a full turn, and substituting factors of 360 within repeat procedures to make "flowers" from fixed shape procedures. The potential mathematical outcome of the Y4 unit linked to above, is way more complex than on first viewing the unit expects, yet if students are to appreciate and understand the outcomes of the tasks, beyond the making of flowers and context is to be given to what is being learned we need to engage the children with the mathematical ideas inherent within it. Perhaps this unit can be taken to pieces, and bits and pieces used or built into wider mathematical work. How might changing our view of this unit enable exploration and application of visual models to support reasoning and understanding about shape?
As I have begun to play with these tools this week, exploring beyond the simple repeat and build procedures I initially work through with students, I am beginning to discover just how superficial my personal understanding and capability with the tool is, and just how big a mistake it was on my part not to persist with the environment in my early teaching career. These short sharp sessions are beginning to challenge me to think more deeply about how I could use tools like LOGO more regularly to challenge and support reasoning and thinking with students during the numeracy hour, a place where I have long believed this aspect of Control and modelling within the primary ICT curriculum should be embedded.
Experience tells me there is a tendency for LOGO to be used and taught in the Primary School these days when the QCA Units for ICT that utilise it make that requirement. This leads generally to control sessions being developed through the delivery of standalone units such as this in Y4. What concerns me about this is not children learning to build procedures that make pretty flower designs, but that from a pedagogical perspective there is much more to LOGO as a learning tool than this. By linking the tool to help develop units of work involving application of knowledge and understanding of shape, space and measure. As a "constructivist" learning tool, LOGO affords opportunities to design learning contexts through which to apply, link and develop strategies for problem solving and investigational work while using the environment to model and explore generalisations and hypotheses.
Thinking about Rectangles
While playing today I have been thinking about rectangles and how, when shown an oblong many of my students are able to identify and describe its basic properties, eg. it is a rectangle, it has four sides, four angles or corners, and each angle is a right angle. When we compare the shape with a square that shares these properties, and the students are asked how they differ? discussions usually begin with how one shape is longer than the other. Further questioning and discussion will lead to us identifying how opposite sides of an oblong are the same length, and how the square is a special (regular) rectangle, but making specific reference to the nature of the opposing sides of an oblong is something which is quickly forgotten.
Coding LOGO to draw an oblong requires us to use and apply this property. Even though the shape has 4 sides, a repeat 4 procedure, would not be an efficient way to input the parameters. Writing even a simple repeat procedure, requires us to think slightly differently about the way we should input our commands in order to draw the oblong. So how might I use LOGO to explore and consolidate understanding about the properties of rectangles as members of the quadrilateral family.
Thinking Through an Investigation
In previous sessions, adapting the QCA Unit linked to above while working with students I have tended to stick to developing regular polygons of a standard side length, returning to making Irregular Rectangles or oblongs later, perhaps if or when students have asked how to do this. This leads to a naturalish discussion about the properties of rectangles.
As said above squares can be classified as Regular Rectangles, as such they have 4 equal sides, 4 equal and identical angles, and the same number of lines of symmetry as they do sides and angles. Each angle is a right angle measuring 90 degrees.
A square can be made with a repeat procedure
repeat 4 [fd X rt 90]
Or using the polygon procedure I published previously, by inputting polygon :side :length.
This would not work for an oblong since adjacent sides are different lengths, while opposite sides are equal.
Building a Procedure to Draw Rectangles
Lets say we wanted the turtle to travel around the perimeter of an oblong 300 units long, we could do this by inputting commands that would draw 2 sides of 100 units and 2 sides of 50 units, using a set of commands that look something like this
fd 100 rt 90 fd 50 rt 90 fd 100 rt 90 fd 50 rt 90
To turn this into a repeat procedure, we could rewrite it something like this:
repeat 2 [fd 100 rt 90 fd 50 rt 90]
So a build command would look something like this...
To rectangle
repeat 2 [fd 100 rt 90 fd 50 rt 90]
end
Saving this procedure, typing in rectangle and hitting the enter key would draw a rectangle where 2 sides were 100 units long and 2 sides were 50 units long.
Building a Procedure to Create Variable Rectangles
The last procedure would be fine if we always wanted to make our rectangle the same shape and size, or we were happy to edit our procedure every time we wanted to change the size of our rectangle. But if we wanted to use our program to help us investigate for example the perimeters of rectangular fields that a farmer could fence with 300 metres of wire? Or the different rectangles we could draw with a particular perimeter it would be useful to have a program where we were able to substitute parameters. (Thanks Andy am having lots of fun with this!) In this case we might use a procedure something like this:
to rectangle :sidea :sideb
repeat 2 [fd :sidea rt 90 fd :sideb rt 90]
end
Investigating Rectangles Maybe!
Now I could begin either inputting side lengths to the procedure to randomly draw different rectangles, or I could begin applying my knowledge and experience about the properties of rectangles, using other areas of mathematical experience such as calcualation, addition and subtraction, halving and doubling etc to help me explore/investigate the substitution values that total a given perimeter, using my procedure to model and test my work by inputting my values and testing on screen. Eg with my length of 300 metres or Turtle units
rectangle 40 110 and hitting the enter key would draw on oblong with this perimeter
40+40+110+110= 300
The procedure models the familiar formula for calculating the perimeter of a rectangle
2l+2w=p
(2x40) + (2x110) = 300
What about rectangle 45 105?
45+45+105+105=300
A suitable problem might be for children to investigate some of the different ways of fencing a rectangular field with 300 metres of wire (using 300 turtle units to represent this).
I don't think I would show the children the procedure and how it works. Instead it might be fun to begin with trial and error processes through the introduction and investigation of a systematic pattern, similar to the example below
40+40+110+110= 300 (rectangle 40 110)
45+45+105+105=300 (rectangle 45 105)
50+50+100+100=300 (rectangle 50 100)
What might the next sequence or input be? What can we see happening in the pattern? What would happen to the pattern if we changed 40 to 41 or 42 and so on? The students could use whiteboards to record their patterns, inputs and informal jottings if necessary, with the focus of the task being around paired discussion, mediated by the onscreen feedback and success of their input in relation to the expected output of a rectangle.
Moving on perhaps we could ask the children to use their experiences to visualise, map out and draw what they think the turtle has to do in creating each of the rectangles they have drawn, focusing their attention to the visible properties of each shape and how these relate to the numerical values they have inputted. Notice the line (perimeter) made by the turtle travels around the shape, so each step carried out must have been in sequence. Even though still focussed on the properties of oblongs and the relative location of their sides, we also have the contingency within this activity to begin to introduce the idea that 2 of the values in each of the patterns are the same, and that as the turtle draws them they output to become opposite sides of the oblong and that adjacent sides are of different lengths. So perhaps at this point we could look at or introduce a simple repeat procedure for drawing a rectangle and explore how each value might be substituted into the program, talking through the effect, drawing and visualising it before returning trying it on screen, perhaps with trace enabled, and finally reviewing our square and oblong, discussing how or if what we have learned during our investigation has changed our view of the two shapes. This might also support introduction of the formula for calculating perimeter of squares and other rectangles, by comparing and deriving the standards from the LOGO procedures.
eg repeat 4 [fd x rt 90]
could be reduced to the perimeter of a square is equal to 4 times the length of 1 side
so p=4xl
repeat 2 [fd x rt 90 fd y rt 90]
could be reduced to the perimeter of a rectangle is equal to 2 times the length add 2 times its width.
so p=2l+2w
Using the rectangle procedure again the task could be extended to enable students to test and investigate the shapes of fields that can be fenced using different lengths of wire by the farmer. What length would each side be if the farmer wanted to make a square field using the length of wire he has?
In class and at table tops, this activity could be further extended to explore the relationship between area and perimeter in each shape, using squared paper to explore the different shaped fields the farmer can make, and the area of each one.
This may seem an ambitious proposal, but I would be fascinated to see just what a KS2 class would make of the activity. I think most of us would be surprised to see just what a Y4 class can learn about the properties of polygons and rotation when using the idea that 360 degrees is the same as a full turn, and substituting factors of 360 within repeat procedures to make "flowers" from fixed shape procedures. The potential mathematical outcome of the Y4 unit linked to above, is way more complex than on first viewing the unit expects, yet if students are to appreciate and understand the outcomes of the tasks, beyond the making of flowers and context is to be given to what is being learned we need to engage the children with the mathematical ideas inherent within it. Perhaps this unit can be taken to pieces, and bits and pieces used or built into wider mathematical work. How might changing our view of this unit enable exploration and application of visual models to support reasoning and understanding about shape?
17.2.08
Expanding my Horizons With LOGO
 Thanks to Andy Roberts for his comment a couple of weeks ago on my post Logo Routines: Building Polygons, where he said,
"To differentiate for the top stream it should be possible to teach the concept of parameter substitution so the challenge would be to write a procedure called Polygon which draws one of any number of sides depending on the number passed across. Most class teachers will stop before getting to this stage, which is a shame because for those who 'get it' a whole new world of constructionism opens up.
I have to admit to being one of those class teachers who never got to this stage, so having had a browse around and a bit of a play, here is my first LOGO procedure using parameter substitution routine, is that the right term Andy?!* It is for drawing a polygon of x number of sides as suggested:
To polygon :SIDES
REPEAT :SIDES [FD 100 RT 360/:SIDES]
END
So if I now if I want to draw a hexagon, I can input
polygon 6
The procedure, substitutes sides with the number six, and calculates the turn size, by dividing 360, by the number of sides I want the shape to have.
If I now input
repeat 6 [polygon 6 rt 60]
I can create a pattern like this..
 I guess my next adventure will be to create a "pattern" procedure or write a program that will allow me to substitute not only the :side parameter in the polygon procedure, but also to include a series of turns to output my pattern drawing on the polygon procedure. Mmmm! Looks like I am all set for a bit of a personal engagement to expand my LOGO programming. Will have a crack at this while preparing my unit of work with the Probot for my students. Maybe you can teach an old dog new tricks!!!
27.1.08
On Coat Hangers, Clothes Pegs and a Poorly Projector
On Thursday the bulb in my classroom projector, not unlike myself it seems at moments recently, announced that it had moved beyond its recommended usable life. Awaiting its replacement, my planning this week, has moved away from ITPs and Smart notebooks, to perhaps the most flexible investment I have made in recent times, in terms of classroom numeracy resources.
 Not digital at all, at least in the computing sense, this tool set consists simply, of a set of plastic coat hangers and 2 sets of coloured cloths pegs, one white and one green. Thanks has to go to colleagues on a recent Y3 Strategy day for introducing these. It is amazing what these things can be used for. Indeed almost anything you can do on a 0-20 bead string, or a bead bar, you can essentially do with these. Setting up numbers of pegs that rely on counting in multiples and then remainders is my current class's favourite thing, right now..
  making say 17 in multiples of 3, with the question "what can you see?" Unleashes a world of responses, around the ways in which students have come to recognise the number, and is beginning to support mental processes around multiplication and deriving number bonds to 20. It may also be a nice precursor to meeting the dreaded division including remainders. Presenting the same number on different coathangers, in different ways, eg multiples of 2 and five for example extends this, and is really helping my support group to see how "clever Counting" can help them make their informal and mental calculation processes more efficient. Commercial bead bars and strings are amazing resources to have around, but I really love the flexibility this tool offers to play with visual number patterns, counting, and number grouping. We have also been using them to support individual and paired work, around rounding and partitioning, in deriving number facts that cross ten boundaries, as well as supporting the consolidation of number bonds and their stories, to support empty number line work.
This week we are working on Fractions, and so alongside dominoes etc they will be used to look at doubling and halving among other things. Bead Strings, Bead Bars really useful tools... But sad as it may sound.... I am loving my coathangers and pegs...
 Not digital at all, at least in the computing sense, this tool set consists simply, of a set of plastic coat hangers and 2 sets of coloured cloths pegs, one white and one green. Thanks has to go to colleagues on a recent Y3 Strategy day for introducing these. It is amazing what these things can be used for. Indeed almost anything you can do on a 0-20 bead string, or a bead bar, you can essentially do with these. Setting up numbers of pegs that rely on counting in multiples and then remainders is my current class's favourite thing, right now..
  making say 17 in multiples of 3, with the question "what can you see?" Unleashes a world of responses, around the ways in which students have come to recognise the number, and is beginning to support mental processes around multiplication and deriving number bonds to 20. It may also be a nice precursor to meeting the dreaded division including remainders. Presenting the same number on different coathangers, in different ways, eg multiples of 2 and five for example extends this, and is really helping my support group to see how "clever Counting" can help them make their informal and mental calculation processes more efficient. Commercial bead bars and strings are amazing resources to have around, but I really love the flexibility this tool offers to play with visual number patterns, counting, and number grouping. We have also been using them to support individual and paired work, around rounding and partitioning, in deriving number facts that cross ten boundaries, as well as supporting the consolidation of number bonds and their stories, to support empty number line work.
This week we are working on Fractions, and so alongside dominoes etc they will be used to look at doubling and halving among other things. Bead Strings, Bead Bars really useful tools... But sad as it may sound.... I am loving my coathangers and pegs...
26.1.08
Starting with Bobby: Exploring Repeating Patterns in a Mathematical Context
 Meet Bobby, a tile character I initially created this morning, to accompany me as I began to explore and think through some of the mathematical possibilities in using QCA ICT Unit 4b to explore repeating patterns. In a previous post I presented some ideas around how I have used these ideas and processes to develop a Design and Technology focussed project using MS Paint. Here I wanted to take a different tack, and expand on and explore another context where I found the process useful, in exploring the language of shape and space through a mathematical context.
Why MS Paint? Well since the PCs I use in school, all run Windows, and those of my students who have computers at home generally work within this environment, paint is a tool, that we have ready access to, frequently underused and exploited, there is the possibility that if excited and motivated by the tasks we develop, the students may choose to extend ideas away from school.
In beginning projects involving repeating patterns I favour an approach where my students begin by making their own tiles, using simple shapes, copy and paste, alongside flip and rotate, to develop more complex designs, that can eventually be used to develop their patterns. Repeating patterns activities such as the one I am thinking through in this post, have it seems to me enormous mathematical potential, an affordance we may not readily associate with graphic and painting packages.
Beginning with the development and creation of a set of tiles based on irregular polygons, such as an L shape, which we can describe as an irregular hexagon or hexagonal, and others such as these examples.
 The sessions might be developed from the limiting of tool use, and copy and paste to develop initial tiles exploring different polygons that can made using only 2 rectangles, perhaps expanding to explore polygons that can be made using 3 and so on, and then using these tiles to support discussion around the properties of shapes. Perhaps we might explore the number of right angles they have? Are the angles always right angles, perhaps inviting reasoning about why the students think this might be the case? What happens if we overlap rectangles? How does this alter the possibilities for polygons we can make?
 In developing these relatively simple "objects" we have begun to think mathematically about the activities we are going to engage in as the process unfolds, and this can be further built upon using the flip and rotate tools as we move to develop our tiles. In MS Paint the flip and rotate dialogue box offers options to flip horizontally or vertically and to rotate an object through 90, 180 or 270 degrees. These can be compared with 1/4, 1/2 and 3/4 turns, that our students may be familiar with through their use of tools such as the BeeBot floor turtle, and maybe even related to table top work related to using mirrors when exploring symmetry. Here we can begin to introduce or develop the use of numerical values for right angle turns with visual modeling and exploration of effect being developed as children create new tiles based on copy, paste and rotation of their original tiles. The idea of angle and a measurement of angles being related to rotation and turn around a point being introduced at the same time, through discussion and exploration of the effects applying these tools to the objects has.
 This tile was created by copying and pasting one of my irregular polygons 4 times, rotating it each time progressively through, 90, 180 and then 270 degrees, and overlaying each newly pasted tile onto those pasted previously. From this context there is the possibility to expand on discussions begun around my Polygon activity, by exploring further, ideas around the properties of the tile and shape created. This shape possesses no line symmetry, as it was made by rotating tiles, it may be rotationally symmetrical however as all of my rotations were through right angles. We could test this together, using copy and paste, and the flip and rotate tool, with the object set as a transparent layer, and by dragging the tile over the original, to observe whether or not the tile is rotationally symetrical. We could also ask what the children notice about the angles? Again theyare all right angles, why might this be so? Using the tile, we pasted and the flip and
  rotate tool, we can make a tile or a shape that does possess line symmetry?
This tile was made using the "flip vertical" tool in MS Paint, by copying
 the tile, pasting it and then dragging to touch or tessalating the two tiles. What will happen if I copy this whole shape and join this to my other tile? How many lines of symmetry do I have? What effect will "flipping" this tile vertically have on the pasted shape and the one I make as a result of
  tessellating them?
Moving on from these simple tiles, the children could be challenged to make their own designs, firstly using rotation tools to make their own simple tiles and then flip tools to make symmetrical tiles, that they can tessellate, by repeated copy and paste.
 Patterns are governed by rules, having produced their tesselating designs and saved, these they can then be coloured using flood fill tools, to follow either given rules or support reasoning and generalisation around visual lines of enquiry. Using save as in between each step of the activity, eg
- Using two colours, make a pattern where no two shapes adjacent to or next to each other are the same colour,
- Create a design where adjacent columns or rows are different colours?
- Use three colours to create a diagonal pattern?
- Use your design, save as and 2 different colours to investigate the different ways in which you can paint half, quarter, three quarters of your design.
- Use a multiples of 2, 3, 4, 5 or 6 pattern to colour your design.
- Colour your design using a multiples of 3 pattern, and then a multiples of 6 pattern. What happens to your design, when the new rule is used? What about a multiples of 2 and 4 pattern, or 5 and 10? What happens to my pattern if I use three colours and paint a multiple of 2 4 and 8 pattern?
As a bit of an afterthought a great follow up to these tasks would be to use a tool such as MS Photostory, to enable children to use and rehearse mathematical language and reasoning by including the digital outcomes of their tasks within a presentation. Dragging the images developed into Photostory, the students might use ideas from discussions they have engaged in during tasks, to record orally their work, ideas and findings as voice overs supporting their images, describing the processes they went through, and using and applying vocabulary developed during the sessions within the production of their presentation. The completed videos would make exciting evidence of learning while also supporting student understanding in using and applying mathematics activities and puzzles, as well as acting as a vehicle for sharing their work with others. These could be published for friends in school, but could also be added to blogs or VLEs for comments by visitors.
What happened to Bobby?
Well here he is and as I have been writing this he has not been far from my mind, in fact I have had a really challenging time working with my fussy friend, while in a mathematical frame of mind, to think about how I could use him to support systematic investigational work with a year2/3 Class or group. How about the possible colour combinations he could wear...
 Despite his complexity, and his inability to tessellate, in his current form he does make some interesting designs and patterns, when used on his own initially to form part of an investigation. I wonder what combinations of trousers and jumpers are possible using only two colours, and what would happen if I had three Colours to choose from to make these combinations?
  How many different ways could he be dressed using four different colours? This as a simple pattern design would make a really attractive wall display!
Maybe extending this to make an initial tile, and using some of the rules from our investigation, we could systematically reapply the investigation to decorate these tiles, For this pattern I had three colours, and tried to find the different combinations I could use to colour opposite characters the same while rotating the colour fills between them.
 As a discussion point, there other whole class possibilities for using some of my original more complex patterns using Bobby. Using an open ended question I might be able to use some of these following student engagement with tasks like those above.......
 Perhaps embedding this pattern into a smart notebook, I could use a hide and reveal techniques to explore the patterns and shapes, asking questions such as What can you see? Is there anything else you can tell me? What shapes can you see? Is their anything special about the colours I have used, and the way I have used them? Encouraging responses and answers to be given in sentences, asking why do you think that? and seeking responses that require and support students as they use not only I think.. or I can see ... statements, but require reasoned "because" type responses to be formulated, perhaps through paired discussion teacher modeling and group rehearsal.
Subscribe to:
Posts (Atom)