Pages

26.5.08

Explanatory Texts From a Multimodal Starting Point

As a class this term we have been reading the Amanda Mitchison Biography "Who was... ? Isambard Kingdom Brunel." The story even though a challenge in places has fascinated the students. The book has proven to be a fantastic stimulus for discussion about the "great man of Iron" but when combined with web based images and tools has also stimulated high quality talk for writing in support of mechanism based explanatory texts .

Of Worms and Men..

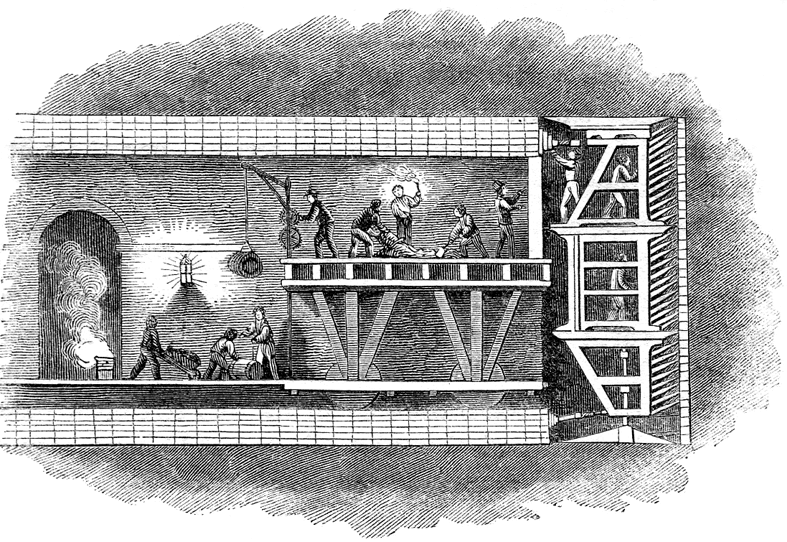
The tunnelling shield invented by Brunel's father, appeared in the opening chapter of the biography and was a great starting point for discussion, one which began with Marc Brunel's observing ship worms at Chatham Docks, before inspiring his idea to dig tunnels through a process of removing spoil, inching men forward in a protective shell and lining with bricks the space behind them as they work. This principle is still employed in modern tunneling, and the enormous tunnel boring machines we see today work on a similar basis. The use of modern control technologies, machine automation of processes, global positioning and monitoring and sensing technologies may have improved navigational accuracy, speeded up the process, but it is no less dangerous today than in the past, spoil still must be removed and the machinery maintained, driven and programs planned, miners still scurry around in the spaces between the tool and the tunnel, lining it as the machine edges forward. The system has advanced, but even as the technology charges on, the principles of its evolution and in many ways its operation remain similar to those originated in Brunel's time. A need is identified, available designs and tools explored affordances exploited to identify possible solutions, before adaptations or innovations are made on these to create a product that either meets our needs, or carries us forward into the unknown. As we have read Brunel's story together I have tried to be mindful of this in the discussions we have had, not only talking about the great man's life and works, but also exploring the similarities between old and new technologies. Not only is this a valuable place to be in terms of historical investigation, comparing past and present, but an essential process based conversation to have in light of a DT curriculum in the England that requires students to engage as designers and makers through Investigation Dissassembly and Evaluation Processes, and an ICT curriculum that requires a similar set of processes to evolve beyond the skills based aspects of the curriculum in developing ideas and exploring the impact of ICT on everyday life.

In terms of Literacy development the formal use of terms relating to "cause and effect" are not common place in the talk that we use or encounter. The written genre of explanation requires us to write from an impersonal perspective and to use "Causal Connectives" such as "this causes, " "as a result," and so on. Taking an impersonal view of the action we are describing can be a real challenge, I remember myself writing science experiments up for the first time at secondary school and being reminded constantly that I needed to use impersonal pronouns while I tried to explain the process as if I wasn't involved. In essence this made the difference between my report being an explanatory text and a set of instructions or a recount. In talking about diagrams such as the tunnelling shield I began the process of modelling the language structures the students needed to hear, that would help them rehearse the written work they would use later. Recording these on the diagrams we explored as a flow chart.

Eg
Men standing in the shield dug out the soil and rock, which was thrown to the ground.
Labourers loaded the spoil into barrows, that were used to carry it out of the tunnel.
As the shield moved forward, the tunnel was lined with bricks, this helped support the roof... and so on.

As the students became more familiar with the sound of the genre, we began to collect some of the words and phrases we were using to display on our word wall.

Converging Technologies

For the last couple of weeks we have been using our literacy sessions to extend our experiences of writing explanatory texts while exploring how some of the technologies that enabled Brunel's visions to emerge worked. We focussed on steam engines and Steam Locomotives technologies Brunel did not invent but was keen to adapt and exploit in his endeavours. To explore the principles behind turning up and down movements into rotary movement to drive ships such as the great Eastern and Western we explored how stationary pumping engines worked. "North Star" one of the first locomotives to run on the Great Western Railway was built at Robert Stephenson's works in Newcastle, and as we had found some amazing material online about Stephenson's Rocket we decided to use this as a model to help us find out about how Brunel's locomotives worked.

Multimodal Starting Points Using Talk to Promote Writing

Within this unit although using some written texts initially to support how the features of an explanatory text are presented and work, most of our activity involved making and using models, and exploring video presentations and animations to help the talk for writing process. During the first week we used videos from Espresso, to share visual and audio descriptions of the processes involved in powering a Bolton and Watt Stationary Beam Engine. We used these video texts to scaffold and rehearse verbal explanations of how the engine worked. As a class we made cardboard models, including linkages and a background diagram of the engine to help us create the link between our talk and the writing we would later engage in. As the children worked with these they were encouraged to talk about share and rehearse with their partners their growing understanding of how these machines worked, gradually being encouraged to expand and present their oral explanations to include a range of sentence openers from our word wall and to begin including the causal connectives they would need to use in their written captions for presentation later in the week. The children were very excitied by the quality of the modelled outcomes they produced, but I was also really impressed by the quality of written outcome produced.

The second week, of activity involved the students in expanding the process previously worked on by creating a similar model of Stephenson's Rocket. We began with the image below left, before the students began creating their own background diagrams similar to that on the right. The students were given a cut out drive wheel to begin with, and the large wheel space at the front drawn in as their starting point. While discussing the source image we also identified that this drive wheel would be where our mechanism would be added to the diagram later in order to give a sense of scale to their drawings.

To support the sessions as the week progressed we used this nice Flash animation from the BBC website as our stimulus for talking for writing. It helped us decide what the mechanism we needed would look like, and to pick out the four key processes we would include. The Steps in our explanation would be

1) Firing up the engine (how the water was heated)
2) Water turning to steam (why the water was heated)
3) Steam forces down the Piston (what the steam was for)
4) The drive shaft turns the wheel (the outcome of all this effort)

On completion of the diagram and mechanism the children were encouraged to explain the process orally to partners and rehearse the captions they would add.
They were challenged to use a variety of sentence openers interestingly several of the students used time connectives they had collected in previous writing session and units to do this. Among the success criteria for the activity was also the need to use the causal connectives we had collected link action with outcome in their model as they described them. I have been really excited by the quality of the children's work. I haven't any photographs of the outcomes from this activity yet, but will include an example or two later. Combining multimodal text use, talk for writing and animated mechanisms however did have a dramatic effect on the way the students finally presented their outcomes. Linking the use of DT to model the process not only gave context to scaffold talk for writing but beyond the DT and literacy based experiences gained from this series of activities, the students were also helped to make links between this and their science work on forces using magnets and springs, and to apply language developed here in their ICT unit on control as we explored how input brings about output.

Image Credits:
Tunnelling Shield from Wikipaedia
Stephenson's Rocket Cutaway From BBC
Student work and outcomes SDMills

5.5.08

Using Textease to make Hide and Reveal Tools

I am commited to a multiple tool approach to working with ICTs and keen to explore as many tools as possible, when writing or developing classroom activities for students rather than simply promoting and sticking with the ones I am most familiar. I feel it is important to be mindful that any one tool rarely meets the identified learning outcomes or the processes we want to use the tools for, either in resource development or with the students during projects. Following my interview with James for the Podium Podcast during half term, I was forwarded some Textease files to play with, they didn't quite fit the bill in terms of the resources I was working on but did excite me in terms of how they and the environment could be used to develop resources and model and make pictograms with students.

There are a number of available tools that can be used to create pictograms as tally charts. Tools such as Interactive-resources' Maths Pack 2 include flash based ITPs that enable class tally charts and pictograms to be made, by dragging or clicking to reveal images. These can be used to support discussion and preparation for students to engage with other data handling processes. IWB Notebooks too can be made, drawing axes using the line tools, then stacks of images created for drag and drop, using the clipart gallery and clone tools to create more personalised pictogram as tally surveys.

The method used to create the pictogram files with Textease, allows a hybridisation of the two process, using the hyperlink tool in the software to create an onclick event. That is to say, to create a file that when spaces within the chart are clicked or pressed, reveal an image or object.

So How do we do this?

The first step in creating a pictogram file is to decide what your survey will be about, and then to collect and import images that will represent and support the data collection process. These images can either be selected from the extensive clip bank provided by the software, or imported from outside the tool.

To create my pictogram I began by inserting one of each image I wanted to use, resizing each one to scale to the chart space I was using. With the images in place and resized I selected, then copied them, pasting repeatedly until I had the number of images I wanted to use in each area of the chart. Next I arranged the images in columns as shown in this image.


Unfotunately at the moment there is no quick way to carry out the following step, which is to create the onclick effect, so each image must have the effect applied individually.

Adding the Onclick Effect

1) Click to select the image (object) you want to hide and reveal on click.
2) Select the hyperlink button from the tool bar
3) Click the animate tag
4) Click in the "hide/show on click," and "hidden on open" tick boxes
5) Click close

Clicking off the object, the next time it is clicked, it disapears. Clicking on the object again, or rather the space where it should be, reveals it or makes it appear.

Now saving the file and closing it, when opened again it presents the viewer with an empty set of axis, and clicking in the spaces reveals the images hidden there. This tool can now be used with the class to collect data, on our journey to school today as a personalised ITP.

However if your school has a network or site license for the suite of tools, the file can also be shared with students to work on themselves. By placing a copy of the file in a shared folder on the network, students can open softease, and the file to work on themselves; customise it based on their own surveys, perhaps by visiting other classes, or the one developed by the class. They could add personalised titles and axis labels, and "save the file as", to personal spaces to maintain the original template.

As you can see the process of creating the file is fairly straightforward so students could also be helped or shown how to make their own and not ticking or unticking the "hidden on open" box, the survey data can be maintained, for use in other work. The outcomes of activities using this tool can also be saved directly or printed out, without the need to copy the screen to another software environment, which is neccesary when using ITPs such as those mentioned earlier. Providing template files with onclick reveal means this activity would be ideal for use with younger students making pictograms, where the charts can be generated quickly, and the focus of Data Handling activity, that of solving problems and asking and answering questions reache with increased pace. Thanks to Doug and James for sharing this technique with me. I hope the post has done it justice.

2.5.08

Which of the Web's Birthdays Will You Celebrate?

Thanks to Andrea Dunn, for posting a link to this very accesible BBC article about the origins and birth of the World Wide Web. 15 years old this week (again)? A Hippo Birdie 2 ewes!

28.4.08

Mapping Landmarks; Digitising the Anologue

Wanted to share a nice activity that we worked on in class today. Our theme is based around being a Bristolian, and last week we identified some of the student's and our favourite places in the city, charting these and creating a simple postcard.

Using the landmarks the students had identified, we compiled a collection of labeled digital photographs, printing them out to use with a tourist map in this group challenge. The following learning story, was compiled in Microsoft Photostory, and uploaded to Google video for sharing.


26.4.08

2Type or Not 2Type: 4

In a previous post, 2type or not 2type, I presented a few thoughts about 2 Simple's 2Type. I was grateful for a number of colleague reactions to this post, offering additional thoughts about keyboarding and tools available to support the development of this key skill.

Anthony Evans and colleagues in Redbridge carried out a school based pilot and action research project using 2 type, his blog post "Touch Typing," presents an evaluation of the project, and is a fantastic place to start thinking about the pros and cons of keyboarding tools and how we might design learning situations that include them in the classroom.

Doug Dickinson aso at this time suggested a number of "no cost" tools to support keyboard skill development including
Thanks to John Sutton @ Creative ICT for directing me to Keybdr.com this morning. This site is another online tool for practicing keyboarding, but there is much more to it than first meets the eye. As well as offering random "natural" text to input, and tools to monitor words per minute; the input language can be altered, and through a cool site feature, a url or feed address can be added to capture text directly for input from elsewhere on the web for copy typing and practice. This certainly is a real timesaver for setting up activities with older students, who could be provided with the url of a particular web space, selected perhaps for theme relevance, to practice their keyboarding while engaging with its content. The "about," tab on the site offers ideas about how to use the game, and explanations of how to change language input and how to enter urls and feeds to support copy text generation . Have fun.

24.4.08

South West Regional ICT Conference 2008

July 2nd sees the 10th South West Regional ICT Conference to be held at the University of the West of England here in Bristol.

This one day regional ICT conference, is a fantastic locally organised event aimed at members of the whole school community from classroom teachers to school governors. It is an opportunity to celebrate with colleagues and share in their experiences of using ICT in the classroom through presentation and seminar, to network and explore tools first hand with exhibitors, while gaining inspiration from the endeavours of a diverse community of practice. This year keynotes come from Doug Brown, John Davitt and Russell Prue. To get a flavour of what is happening at this year's event the programme can be downloaded from here, while an archive of presentations and audio files from previous years including last years inspirational key notes by Prof. Stephen Heppel and Lord David Putnam are available here.


I have exhibited student work a couple of times at the conference, but this year am really looking forward to the opportunity to share some of my experiences in a presentation around cross curricular opportunities for Control.Inspired by Doug Dickinson this is hopefully going to be bit of a blogging experiment too. I am saving the rest for later.

22.4.08

So What is Podcasting?

I was really pleased to find this in my feeds today, a video from the fine folk at CommonCraft that explains podcasting as only they can... Ladies and Gentleman this is Podcasting in Plain English

21.4.08

Podcasting about Podcasting

Last week, I was interviewed by James Watson of Softease, about my experiences using their school podcasting solution Podium in the classroom. James has used this interview in his own Podium created podcast called Podcasting in the classroom launched today through the Podium Blog

The first episode features James himself introducing the series and its aims, and eloquently explaining what Podcasting is (and is not) while outlining some of the benefits the process may offer for engaging learners in the classroom. The second episode features an interview with the voice behind this blog, recorded last week, sharing his experiences of using Podium in the classroom while exploring and expanding on some of the ideas, I have written about here. I hope you find this useful, but also that you take the opportunity to subscribe to what promises to be an interesting series of programmes. I am certainly looking forward to downloading and listening to future episodes and sharing in how others are using podcasting as a tool to engage students and inspire learning in their classroom. Thanks James:o)

20.4.08

Stick Figure Animator is still a hit

Untitled Animation by C. Click on the image to view the animation.

A while back I published a stick figure animation by one of my students called "The Box." He recently sent me another creation, with no title, and here it is. For some reason Blogger doesn't want to play the file in the page but clicking on the image will open and play the file in a new page. I really like it, because knowing C and the software tool he used I recognise how much effort has been put into its creation and how the narrative it carries draws on and expresses an enormous amount about the visual nature of the process he brings to all his literacy activity. Every frame in this clip has been added by hand, and the narrative presented shows how far he has come, independently in his understanding of the animation process. Motion and transitions are much smoother in this movie than in his previous attempt.

It never ceases to amaze me just what our students are doing with ICTs when not in school, and how easy it is to underestimate their creativity and capabilties with the tools they use and have available to them. Well done C and thanks for sharing.

Eureka! Using Line Graphs to tell stories

I wanted to share this web based resource with everyone since I've been writing about data handling this week. Its been sitting, soaking and reclining in my bookmarks and at the bottom of the Maths recources page in our school web site for ages, but is a really nice resource to use as a starting point around time and change using line graphs.

Bathtime with Archimedes now on ColemanWeb, is an interactivity, that uses a combination of animation and pictorial representation to model the principles and effects of displacement. While users run the model a number of variables can be altered, you can turn on or off the tap, put in or remove the plug, and have Archimedes sit in or get out of the bath. As these "physical variables" are altered and the model is run, the level of water in the tub obviously changes, and this can be observed by watching the position of the rubber duck in the tub, my personal favourite touch, but also a line graph that is created to coincide with the events as they are carried out along the bottom of the page. Time and depth values are also recorded as the model runs in a table to the right of the screen.

As a "shared text" during maths or science sessions, this tool affords lovely opportunities to draw on the visual elements as the modelling process unfolds to support oral work, through engagement with the chart to recount the story and events that lead to its creation. Screen capturing the model, or a previously created model to an onscreen notebook, opens possibilities to engage students with the resultant image multimodally, and the use of hide and reveal techniques to mask areas of the image, promoting and focusing discussion, to draw on their previous experiences.

Following this up students could be provided with a one I prepared earlier version of a bath tub model presented as a line graph created in a spreadsheet, and asked to prepare a recount or story around the chart.

I put in the plug and ran my self a bath. I was just settling down when the phone rang, I got out of the tub, it was freezing as I dashed through the house but before I could get there the caller rang off. I clambered back into the tub. running some more hot water before laying back to relax.

Alternatively students could tell stories for others to sketch, using discussion to generate the charts they think would result from it. What do you think?

16.4.08

Making Dynamic and Interactive Pictograms With MS Excel

I've had a spot of Blogger's Block lately, but thought I'd try to get back into writing by asking what you think of my Pictogram? Cool huh! Inspired by a Twitter thread this week I thought I'd share the process I used to make it and a few thoughts about why this simple technique excited me so much when I discovered it accidentally and in true "IKEA man" style a while back.

I have used Excel with Key Stage 2 children to support data handling activity for a long time now. It was originally part of our BEON Project toolkit back in the 90's, but the more I use it as a resource development, teaching and learning tool the more I realise how I have only ever really scratched the surface. Even amid the excitement around available online applications such as google docs with its frequently identified opportunities for collaborative data handling activity, and open source alternatives such as open office, it still, after all this time manages to throw up surprises, things you wouldn't expect in an application with it's intended commercial audience.

Why is using Excel to create Pictograms so exciting?

The most powerful affordance of Excel, which it shares with other spreadsheets is its "dynamic" aspect, any chart we make is not fixed, but automatically updated if we change data in the cell range that created it. The speed of rerepresentation is one of the key reasons I would choose to use a spreadsheet for data handling activity in the classroom, (that and of course in real life contexts spreadsheets are usually used for this purpose and not generally "data bases.") With the entry of new data, it is possible to observe immediately the effects that this has on the chart we have made. We can change the scale of a chart and observe the effect that this has on the apearance of the data. We can filter and sort data, and discuss the effect this has on the reader's ability to interpret particular types of question, perhaps we might even structure our filters to match criteria we have identified from a question. We can propose models, make predictions and inferences, by asking what would happen if questions, then change the data, (perhaps using formulae to help) and observe the effect in the charts we have made.

A really nice task I did with year five and six students last year involved collecting and logging data about how we used our time over the course of a week. Using formulae in our spreadsheet to help us calculate the amount of time we spent doing particular activities, how many hours a day we spent in total engaged in tasks the idea being to ensure we didn't overspend our 24 hours. This did yield some interesting thinking points for me later about students and multitasking, but that should probably be saved for another time. In addition to standard formulae we also calculated the average (mean) time we spent doing particular tasks, finding modal and median values for tasks to compare directly time spent across the week, before charting these.

If you have used Excel to create charts with students it is more than likely that before you have had time to turn around they have gone on to discover without your help how to recolour the sections of the charts they have made, passed this on to their neighbours and gone on to play with the fill effects tool. It is this tool which is key to making your chart into a pictogram, since here you can import images to chart columns to change their appearence. Eg
  • creating a chart to show the populations of countries,
  • comparing the heights/weights of dionosaurs
  • surveying traffic or modes of transport we used to get to school
we could insert a downloaded image of each nation's flag, the dinosaur or vehicle type as the fill for it's column.

What may be missed in this process however is the key to turning these charts into pictograms, the tick box that enables you to scale the images, and the text box beside it that allows you to decide on the unit each image in the column will represent.

Making a Pictogram with Excel

Creating the chart

  • Input your data to the spreadsheet
  • Select the Cells containing the data you want to use by clicking and dragging to highlight it
  • Click on the chart wizard and work through the process to develop a column or bar chart, adding axis labels, a title, deciding on the numerical range for the y axis and so on.
  • Select where you would like to insert your chart, in the curent page or as a separate sheet.
  • click ok

Editing the bars to add a background image

  • Click once on the bars to select all and then again on the individual bar you want to change
  • Double click to open the colour swatch, and select fill effects
  • Click the picture tab
  • Click select picture and browse to find the image you want to use in your column
  • Click OK

Now if you click OK again the whole image will be stretched to fill the column

Turning Your Bar Chart into a Pictogram

Having followed the process above to insert a stretched image, double clicking and returning to the fill effects dialogue box you will see to the lower right, the "stack and scale to" tick box.

  • click in the "stack and scale to" box
  • Enter a value for the image to represent in the text box below this eg 1 scales the image to represent 1 unit, 2 scales the image to represent 2 units in the chart and so on.
  • Click OK and return to the chart, to see the effect.
Do you want to use your chart as as a Pictogram or a Block Chart?

This affordance of Excel as a tool I think is really useful for helping develop resources to bridge the relationships between chart types. I can make several versions of the same chart, and edit each one to support discussion. Eg
  • A bar chart (with all chart features included, but no scaled images in my columns)
  • A Block chart (with all chart features included, with scaled images in my columns)
  • A Pictogram (with axis scales removed)
With the chart completed I can decide whether I want to keep axes and grids, and if not simply click on and delete chart elements and features I don't want to include.

Pictorial representations must be read, inorder to make meaning from them. Creating charts that include or exclude features allows us to treat them like Mathematical "cloze procedures," that allow inference and engagement with them as meaning making structures.

The nice thing about using a tool like Excel to do this is how we can repeat the chart making process, representing the same data in different ways, and even present the pictogram as a bar chart with complete scales and axes to consolidate the similarities between the chart types. Changing the data in the spreadsheet itself will update all of your representations simultaneously, and save time, in presenting the data for further discussion and review. Adding these as copies, or saving the file as will allow you to keep your original template.

Using these artefacts as tools beyond Excel

When preparing notebooks for the whiteboard, these charts can be selected, copied and pasted directly to the notebook page, and then using hide and reveal techniques focussed discussion can be developed around the charts.

Charts Like these tell "multimodal" mathematical stories. Stories that can be set in a range of cross curricular contexts, and as such these must be explicit through titling and axis labelling primarily. As well as engaging students with the subject matter though it is important to read the scale and legend, to help us to characterise and populate our story. When creating charts to share with students I like to begin discussion with a chart or charts where all written elements have been hidden including scale values.
  • I prepare notebooks using the pen tool and white ink, to cover these.
  • During the lesson or shared task these are gradually removed using the eraser as discussion evolves around the "shared text."
Beginning sessions with charts where no information is visible other than the image representing the data, and asking children to discuss and make suggestions about what story the chart might tell opens up opportunities to evaluate student knowledge and experience around the chart type, as well as to ellicit understanding of how the chart might be used. Asking what other information we might expect to find, and then rubbing to reveal suggestions using the eraser, allows us as a class to gradually build up a picture of the story the chart is telling, before engaging with any interpretation of the representation.

Making Links Between Representations

Starting with the spreadsheet enables multiple representations of the same data to made and edited adding or removing elements to change the form that the representation takes. Inputting new or updated data to the spreadsheet, will dynamically alter the representations made from the range selected allowing comparisons to made as the session progresses. This process is possible with the other tools I explored too when thinking about writing this post, however what made Excel different was the pictogram, none of the other tools I used or had available to me this week allowed this.

As a time saving device this tool has been an exciting find for me, and I hope you find it useful too. Happy playing.

8.4.08

Meme: Passion Quilt

I was tagged by Angela Maiers, a week or so ago to take part in the Passion Quilt Meme. First of all I want to apologise for the time I have taken to respond, but I have struggled a bit with this. I was tempted when I first received Angela's tag to search FlickrStorm for a graphical metaphor or two. However this didn't seem quite right since my "inspirations" usually comes from the students I work with, the experiences they bring to school and share with me. My blog is as much a celebration of their achievements and what I have learned from them, as a place to share and explore my use of ICT in the classroom. Within our PLNs students are key and central players, effecting every decision we make, keeping us on our toes and contributing to, leading and initiating the learning conversations that drive the communal learning experience we share. Student voice is what keeps us in business. Learning is built on common experience and the negotiation of shared meaning.

This image, "I'll be the narrator and you can be baby bear!" represents a key moment from my classroom this year and the role of ICTs in education as I see them their potential and capacity to support, develop and enhance "Learner Lead Learning." Learning to share, engage with and represent our ideas to a global audience must by default expand our view of text and textuality into a multimodal domain. A view of textual engagement and development that sees language alone as the vehicle for communication will not help overcome communication barriers as we strive to achieve this. The promotion and development of Multiple literacies must be a key element in developing communication and designs for learning for the future, and is an underlying theme for much of the work I present and share here. The "C" in ICT represents communication, but can stimulate so much more from its users creativity, community and context among others, my passion is to explore, unpick and engage colleagues and students with the potential that these ideas bring to learning to learn as we develop a pedagogy for the 21st century. A bit grand perhaps, but Passing on...

Here is how the Meme works :

  • Post a picture from a source like Flickr Creative Commons or make/take your own that captures what you are most passionate about for kids to learn…and give your picture a short title.
  • Title your blog post “Meme: Passion Quilt” and link back to this blog entry.
  • Include links to 5 folks in your professional learning network or whom you follow on Twitter/Pownce.
I now pass on the torch to Linda, Anthony, Nicholas, Tricia and MissTizzy.

3.4.08

Bristol Past and Present

Have just discovered this fabulous web based resource " The Changing Face of Bristol England and It's People."

This image from the site and acredited to Paul Townsend, is part of a vast collection of images both on the site and in the Site's Google Earth Geotagged Set. However watch carefully because there is more to it than meets the eye, once on the site follow the Bristol Then and Now link for further examples.

I like the idea of Geotagging Historical images, it gives them a presence and point of reference in the here and now. Perhaps even more powerful for me in this site though is the use of image swapping through animation, allowing direct visual comparison between street scenes in the past and images captured at the same location more recently.

I have pondered a number of times on how cool it would be, to enable use of old photographs with students in this way, using digital cameras to frame shots as they engaged in a kind of historical orienteering activity, collecting images on trails perhaps before using other digital tools to morph between one their modern image and the old photo they had been given as a reference point.

In our modern cityscapes, with potential access to mobile technologies and GPS this strikes me as an increasingly practical possibility. Paul's site provides some interesting models to use and share when I next set out to explore this with colleagues.

It also represents a fantastic visual history resource for the people of Bristol. Thank you.

Historyman's geotagged collection of Memories of Bristol, can be found on Panoramio.

Adendum Pictorial tours of the city from About Bristol

29.3.08

Making a Layered Text With 2 Create

In my last post I mentioned using 2 create to develop homemade layered texts, that work in a similar way to those developed by the Hamilton Trust. With a Year 4 class I originally used Powerpoint to do this, while working on our theme around the Romans in Britain. As a class we developed a paired collaborative writing project based on the life of a slave boy called Victor and used this to frame a "really long historical story."

We used available non fiction texts and Scheme materials including secondary and primary source material to support the information gathering process, and began exploring through the use of images, talk for writing and role play, how it might have been to be a slave of Victor's age. From the information we had available, comparing this with our own lives as we tried to develop empathy with our central character. The text presented in the flash presentation below was developed over the course of our writing unit, during guided and modelled composition activities. It was originally part of a PowerPoint story, including hyperlinks to lead us off to the stop and think areas, that were developed, we hoped, to engage our readers with the story in a different way. Adding depth to the engagement our readers would have, by asking them to explore aspects of the story we had written more deeply, and doing things in response to our writing.


Using 2Create to Add a New Dimension to an Existing Idea

This morning I have been playing with 2create, by 2 simple, and as I mentioned in my previous post, this tool has the ability to export, what is in this case a mirror of the powerpoint show we originally created as a class, in a flash format. To create the basis of this presentation, I opened 2 create and inserting the same number of slides as I had in the original PowerPoint show. Toggling between PowerPoint and 2Create I copied the content of each slide from PowerPoint to its corresponding slide in 2Create.


Bringing the Show To Life


Adding Common Navigation Structures to the Show

With the content in place, I then added a series of common buttons for navigation.

  • A back button - to take us to the previous slide
  • A next button - to take us to the next slide in the story
  • A home button - the house, to return us to the first slide in the show
  • A thought bubble button - to take us to one of the stop and think or explore pages.

For ease of development, I made one full set of buttons opn the first page, and then selected, copied and pasted these to each of the slides in my 2create presentation.

It is important to emphasise to students why common navigation structures are neccesary in texts such as this which have strong parallels and models in the web sites we visit. The navigation structures help our readers understand how the text we have and are creating is intended to work. Readers need this in order to help them engage with our work in the way we intended. Good Authors of course take their readers into account when they are writing. Not all student shows need to have the same navigation tools or symbols, but within each show or text the navigation style should be consistent.

Linking the Pages in the show

With the navigation buttons in place, hyperlinks can be added between slides, allowing readers to turn or move from one page to another. In 2create this is done, by

  • Clicking on the button or object we want to use as our link
  • Right clicking to reveal a context menu for that object.
  • Clicking the actions tool,
  • In the "actions" dialogue box. Clicking the "turn page" tab,
  • Selecting from the drop down menu the page we want to link to, before pressing the ok button.

When working with the students on our mapping project they were required to give each page or slide a name, so they could see at a glance where their buttons were leading to. You may find this process useful too if you decide to play with this tool. This process was repeated with each button throughout the show, with buttons not required on certain slides being deleted as I went.

Testing the Show

This may seem obvious but when building or compiling anything with Hyperlinks in I always try them out locally or through preview, to make sure they lead to where I want before I publish. Pressing the green play button in 2 create, compiles a flash file to run in the program, so the look, feel and navigation of the project can be trialled and evaluated before being published. Working on our mapping project the students have been encouraged to engage with this process continuously as their atlases were being developed, it has a kind of a DT feel to it, but in projects such as this we are not just learning ICT skills we are creating content and authoring textual spaces that we want our readers to engage with. There is nothing more frustrating than engaging with an online text and then hitting a dead link. It is advisable therefore to spend time working through the text you have created or encouraging the students to spend time playing in their own texts before publication.

Publishing the Show

Using 2create, the slide show can be saved in the software's native format (.2cr), but also exported as a "Flash File." (.swf). Flash Files, are a web standard format, many of the websites we visit everyday use flash, BBC Bitesize interactivities are flash files, and the navigation panel in "Espresso" for example is flash based. Flash files can be added to the school website, and as you can see here to a blog so visitors can engage interactively with the work we or our students have developed through 2create. In order to have the file run, it must be uploaded to a web host in the first instance, this file has been uploaded to the file storage space on my web site and then linked to the blog through a piece of code I borrowed from "Flash For Blogger -Dummies Guide."

The SmartBoard's Notebook, is also enabled to allow the inclusion and use of flash based interactivities. So the files developed in 2create can become additional multimodal resources for use on the IWB.

Slideshow Credits: Original Story by SMills and Y4 (2004) Teyfant Community School, Redeveloped by SMills in 2create 2008

28.3.08

Active Mapping and 2Create: An Example Outcome

I've posted a number of times in the past about 2 simple's 2 create a story, and how I have used "export as flash," to create web publishable interactive texts with students. 2 create has been the tool of choice this term, and it too has an "export" or "save as flash" file option. The big difference between the two tools as you will see from the example below, a sneak peak from our mapping project is the ability to develop your own navigation paths, by inserting buttons and hyperlinks.

By exporting as flash the 2 create project is also useable as a portable/standalone presentation, that can be run not only in web pages like the one below, but can also be inserted and played in a Smartboard Notebook, as part of a presentation. So as part of a teacher resource development tool box it is also apotentially powerful tool, that could be used to develop layered texts, similar to those developed for the National Literacy Strategy's IWB Packages using PowerPoint, and the flash based multimodal stories presented by the Hamilton Trust.

The flash file below, exported from 2 create has been uploaded to our school server, using the portable apps version of Filezilla I downloaded last weekend, and then embedded here using a piece of code I found on Flash For Blogger-dummies Guide.


Now I know that this works, I can spend some time with the students next week using this tool to show how their completed files get onto the web on the IWB, before using the embed flash tool with small groups on our class wordpress blog to share their maps as they are finished. A big well done to T and P, who developed this file. What I was particularly impressed about with this example, is how the two students themselves decided to label the buttons. This they said was to help their visitors understand how the map worked and where they would go on their journey. I hope this illustrates the kind of learning outcomes that were achieved and presented in my previous post. Top job Year 3.

Image and File Credits: Maps. worldatlas.com Photographs and Slide Show: Y3 Teyfant Community School

25.3.08

FlickrStorm: How Would You Use the Image Returns?

Loved this atmospheric image by Andy100, of the Clifton Suspension Bridge in Bristol, found using FlickrStorm
and the search word Brunel.

Am beginning to think about and collect material to support next term's theme "Being a Bristolian," and this is certainly the suspension bridge as I have never seen it before.

Would be a really nice starting point for talk for writing, perhaps leading to some incidental poetry.

I used a host of words and phrases, this evening some really abstract, but amid these I really liked the returns for colours.

Downloading and saving to a shared space as a colour collection maybe we could use some of the "colour" image returns as a group resource and writing scaffold for textured poetry using Powerpoint. Presented as a sequence in Photostory, the poems could be performed to create a video montage to be vodcasted by the students.... Podium Multitracking might also be used to create an atmospheric soundscape to import and background these poems?

How would you use the Image Returns?

23.3.08

Scratch and

I was desparate to call this post "Scratch and Sniff," as really that is all it is, a tip of the iceberg set of statements and a momentary expression of appreciation about a tool I have been pointed to a number of times through blog posts, feeds and del.icio.us. Until a recent post and a thumb's up on mrstucke's Masterplan I didn't realise just what I had missed out on by not actually installing the download I had made or looking further than the handful of videos on the tool I had watched. Installing the application, taking a spot of time to aclimatise and familiarise myself with the environment and its visual tool box, it has been really cool to watch kitty boogy his way through a set of routines I had previously scripted for my turtle in LOGO.


Can feel a few posts of my own coming in the future. Thanks Daniel. Interested in having a play for yourself, you can download a copy of Scratch from here.

22.3.08

The Bayeux Tapestry

Yet another You Tube Video, but this time courtesy of Joe Dale's Blog.Here he has pointed readers to this amazing Animated version of the Bayeux Tapestry by David Newton, and additonal online resources from The Museum of reading.


Taking Joe's post a little further, I was just thinking from a Primary viewpoint what a fantastic starting point this could be for supporting and framing class based empathetic and historically based activities, with a multimedia or multimodal ICT based outcome. Using an extended literacy unit in the Autumn Term we worked with our Y3 students on something similar developing Digital Biographies and Podcasts about Henry VIII. This resource cries out for something a lttle special to happen to it after its use, building on the student's first hand experience and engagement with the medium to develop digital recounts, non chronological reports or persuasive texts as outcomes. Perhaps interviews with characters from the tapestry could be developed as incidental writing outcomes that lead to a class Podcast, maybe a News story live from the battle, or a diary/documentary/vodbox that follows one character as they travel through the tapestry to victory.

Using images from the online resource at the Museum of Reading Site, tools such as 2 create, 2 create a story, PhotoStory or Movie Maker, could be used alongside the classroom work students are engaged in to create a multimedia version of the story recounting the events, building on class based activity, perhaps resulting in a vodcast. A more ambitious project might be to take a "CommonCraft" type approach like the one I explored here, splitting the story into parts and challenging students as a talk for wirting project to work in groups as a class in planning out, scripting and making their own animated/narrated versions of the story as the outcome for an ongoing ICT unit, using photostory, digital blues/webcams and MovieMaker, editing the completed story together as a class. Thanks Joe.

Fancy using this video with your students, then I have provided some notes on how to download videos in different standalone formats from YouTube in this earlier post.

Making a Portable Apps Tool Box

Imagine an ICT toolbox that you can carry in your pocket. A resource set that everyone could share for free. No need to beg that the tools you regularly and choose to use be installed on the platforms you will use before you begin a session. A cornucopia of hope?!*

On Thursday evening I found myself browsing Computer magazines in a Local Supermarket and drawn to the caption "Ultimate Portable Software, store top programs in a USB stick" on the cover of "Web User" magazine. With the Idea of "Anywhere, Anytime Learning," and the principles of "collect, store and share," firmly in my mind, from a funding grant bid this week, the prospect of having a potential toolbox that could be carried in mine or my student's pocket was an Intriguing prospect, and one I decided to investigate further through a visit to the core website, PortableApps mentioned in the article.

PortableApps are versions of existing open source environments, that have been redeveloped for download and installation to run from portable devices such as USB flash drives and mp3 players, and maybe even as the site suggests your iPOD. Once installed to the device, simply docking it with a computer and running the interface or application's .exe file the user has access to a set of generic and "familiarish" applications. Why familiarish, well this is a me thing, keen to try out the GIMP, running from my flash drive to edit the image above, took a little playing with before I finally worked around the process that would have taken seconds in the tool I usually use. This however is no hardship simply a quirk of the tool, and part of a learning process we go through now and again when engaging with something new.

Visiting PortableApps and downloading these applications today has really stimulated me to think about the potentials they offer from a curricular point of view, in terms of shared and common tool access. Since these tools are open source they are free to download, use and distribute under GNU licensing, which could have huge potential for us, as we seek to address issues such as home access to tools and the proposed "digital divide." These tools could potentially enable access to all students for the cost of a flash drive, to a tool box that could be selected from to support a collect store and share process developed through home based learning, and accessible on any windows based machine. So what tools did I think might be useful and download to my flash drive to play with:

Accessibility Tools
  • On-Screen Keyboard Portable - on-screen keyboard
Graphics & Pictures
  • GIMP Portable - Photo and Image Editor

Internet
  • Nvu Portable - KompoZer Portable - WYSIWYG Web Page Editor
  • FileZilla Portable - FTP client (our Website is not entirely web 2.0 yet)
  • Mozilla Firefox, Portable Edition - the award-winning web browser (love it and we haven't been able to run happily on our network yet)
  • Mozilla Thunderbird, Portable Edition - email client including RSS feed reader

Music & Video
  • Audacity Portable - Audio editor and recorder
  • MPlayer Portable - Movie player with support for most video formats
  • VirtualDub Portable - video processing and capture utility
  • VLC Media Player Portable - Media player that plays most audio and video formats
  • CDEX Portable - My favourite Audio CD Ripping tool

Office
  • Mozilla Sunbird, Portable Edition - Calendar and task management
  • OpenOffice.org Portable - word processor, spreadsheet, presentations with Microsoft compatibility
  • PDFTK Builder Portable - split, collate, watermark and password protect PDF documents
  • Sumatra PDF Portable - PDF viewer

Utilities
  • 7-Zip Portable - File archiver and compressor
  • ClamWin Portable - Antivirus on the go
  • PeaZip Portable - Easy to use file archiver and compressor
  • PortableApps.com Menu - integrated start menu bundled with the platform
There has been considerable debate and discussion about open source versus commercial product use in education for some time, but the emergence and recent excitement generated by devices such as the Asus ee, developed around the Linux GUI and shipped with Open source tools seems set to at least for the time being reduce polarisation of this debate shifting our attention to addressing how we intend to integrate, embed and use these devices to enhance and change our view of home school learning. Using them initially as "collect, store and share devices," is how I hope to begin this process, with colleagues and students within our portables project. Exploring how we extend home school learning tasks, through the planning and creation of content for inclusion in shared school based activities using existing tools and online environments we already use and are familiar with. Providing a local, common and shared set of applications, in the first instance means that students would not be entirely disadvantaged by not having web access at home, as content developed away from school can be built on and shared through access to a wireless infrastructure and classroom based web acccess, or alternatively direct transfer to the network through flash drive. To enable this however the tools for the job must be available. Certainly the Asus provides a basic toolbox, but it would be handy to be able to run other more complex tools as the students become more familiar with the process, if we would like them to support driving innovation. Since current E Safety considerations limit access to the web 2.o world in schools then local apps are required to do this, many of which are currently not available through edu suppliers for Linux based systems, or Window's Mobile Environments for that matter. Portable Apps has a watch this space.. regarding Linux based versions of the applications they currently offer, but certainly these tools seem to me to offer enormous potential in enabling expansion of the tools provided. So in answering my opening question probably more a cornucopia of hope than a complete solution, but certainly something well worth keeping an eye on. In the meantime I will play with the toolbox I have just compiled, and continue to chew over some of the ideas.

21.3.08

Technology Changes: Help Desk Fun From My Feeds

Through my feeds today I encountered these two YouTube videos.


I hope they entertained you as much as they did me, they certainly rang a few bells.

Thanks to Tony Karrer and Karl Kapp

Inclusion Resources Online, Portable Apps and The Transporters

I have been following Anthony Evan's recent series of posts with interest, as he has trawled the web logging tools available online to support inclusion. Many of these freeware or open source environments may also be of interest to colleagues working with younger students, and interested in exploring tools available outside of mainstream suppliers to add to their software tool boxes well worth a visit to explore his recommendations.

On a visit to one of the sites linked from Anthyony's Blog, SEN Teacher, I came across "The Transporters," developed in partnership between Culture Online, Cambridge University's Autism Research Centre, Catalyst Pictures and the National Autistic Society. This Online Resource uses Thomas the Tank Engine like characters, to explore through stories, narrated by Steven Fry, how facial expressions portray emotions. As with most tools such as this they are adaptable to meet the needs of individuals. In my class I have a number of students who find difficulty in reading and comprehending the reactions of their peers, and whose emotional maturity may make this space valuable additional resource to use alongside SEAL resources already available.


With the recent emergence of Linux based tools such as the Asus ee, primary colleagues, might be interested in exploring some of these tools too, as I spotted one or two among these that offered Linux versions for download. Following a browse last night through a computer magazine at a local supermarket, I am hoping to find some time to have a play this weekend with a collection of "portable Applications" recommended for download to USB and Flash Drive. Among these was a version of Open Office, Audacity, Firefox, the GIMP and a bookmarking application, that run directly from the Flash Drive. Having just submitted a bid to develop an Asus project with our Y5 students, it will be interesting to see whether there are Linux Versions of these lite applications, and how easy it would be to run and integrate this use of software with the portable platforms. Instead of wheeling out the laptop trolley, perhaps we might find ourselves handing out the flash drives? Interesting thought! But something to be followed up later.

19.3.08

Active Mapping and 2Create

This term my students have been working on a Geography Theme around their local area, that lead as an aside to a number of post on using Quikmaps. My curiosity about how to tag images in this environment emerged from work I was doing with the class anyway, using digital images to map our locality, firstly on paper and alongside this using 2 create by 2 simple to develop a simple zoomable atlas.

The project began as a means of supporting understanding of their place in the world. Our starting point was on the amazing worldatlas.com website, where students were encouraged to explore the site by gradually zooming into the UK, saving copies of maps from their journey through the website as they went. These images were saved locally to their home drives for use as the project developed, and included
  • A World Map
  • A Map of Europe
  • A Map of the UK
  • A Map of England
  • and A Map of Bristol
The final map they needed for the project, showing the school and our environs was a Quickmap, that I developed for and with them, showing the route of a walk we took around school, to which I tagged, photographs taken by the students on their walk, for display on the school website, and use in a small video project about our favourite places.

With these images stored, the students used 2 create to make an initial 6 slide show, and on each slide they placed the the maps in "zoom order." The next stage was to use buttons to locate the zoom point for the map, a button being placed on Our home continent, The UK, England, Bristol and so on.


Right clicking on the buttons, actions were added that hyperlinked each location to the map associated with it, so clicking on the Europe button would take us to a slide with a map of Europe on it, Clicking the UK button there would take us to a map of the UK and so on, until we eventually arrived in Bristol. On the Bristol map a button was added to take us to another slide yet to be created where the aerial photo developed in Quikmaps would be located.

Getting the aerial photo we had made in Quikmaps was achieved by making a screen print. With the Quikmap in the web browser window, the print screen key was pressed, then in a graphics package, this image was pasted and cropped, before being saved to a shared folder for the students to use in their projects.

For the next stage of the project all of the photographs taken by the students on our walk, and during subsequent activities about our favourite places in school were copied to a shared folder alongside the quikmap as a shared resource for the remainder of the project. The students then inserted the quikmap image to their 6th slide. In their groups they decided which of the images they would like to use in their project and added additional slides to accommodate them.

With the Quikmap inserted, and their chosen photographs added to the additional slides, they then set about linking each photograph to its location, inserting multiple buttons to the quikmap, using place holder pins as reference points that enabled them to think about where each location was in relation to the others. On the photoslides adding backlinks the map enabled the document to become a kind of virtual tour too, as the reader is directed to return to look at other locations they have photographed.

The whole process has been incredibly exciting. The use of talk throughout, has facilitated through discussion the use of subject specific vocabulary in context, we have used maps to begin engaging with the scalability of the world from landmass and ocean, to continent, country city or town and region. Within our locality we have used maps to find and estimate position of place in relation to others, as well as to help observe features of our place in space. As an active mapping project the children have not only experienced a diverse and challenging set of ICT skills, but they have used these practically to consolidate geographical concepts moving from a global position to hands on mapping of their own locality. I will hope to share some of these projects, by exporting the projects to Flash, and embedding these for exploration on the school website soon, alongside the video project which is emerging using photographs to talk about our favourite places.

18.3.08

The Common Craft Show: Some thoughts on Visual Story Telling and Animation

The Common craft Show, published by Lee and Sachi LeFever, has really helped me understand some of the principles and ideas I found tricky to explain to friends and colleagues, particularly blogs and wikis, and the principles behind RSS Feeds. During the Summer I was drawn into the "Twitterverse," following friends and fellow bloggers in between posts. An "enthusiastic lurker" perhaps more than a proactive participant, but nonetheless Twitter as a tool has fascinated me, like so many environments in the web2.0 world in terms of its hidden or not quite yet discovered potentials. It has among other things been used to facilitate audience participation at a number of conferences I have attended lately, through live publishing of comments and questions among other things during presentations and events, so when in my feeds and tweats I found the folk @ Commoncraft had made a video about Twitter, how it worked and how it was useful, I was quick to take a look.


This post is not about Twitter actually, sorry... Its more about the "CommonCraft" style and approach, and the additional videos I found in the catologue after watching the Twitter video and the inspiration that they evoked around the potential of this style of presentation for use in the classroom. As you can see the video presentation is chatty, friendly and I think enormously appealing. The professional homemade look and feel, I think lends them beautifully to a genre and style of animation and presentation that could be readily adapted and used to develop multimodal writing outcomes with students in the classroom.

My experiences with students, tell me how challenging amid the excitement of making a film students find taking time to frame shots, waiting for that hand to get out of the frame. It is usually not until the finished product, as they see it, is aired, that groans emerge about the hand in frame that shouldn't have been their. While watching the Commoncraft Show again this week, I have begun thinking about how often my intentions and desired outcomes may overcomplicate what is neccesary to enable the technology to fulfill its roles in class based animation activities. The students are usually happy with the work they make, and the outcomes they achieve excite and motivate them. I began wondering just how important in using audio and video as a writing medium it really is for students to be hindered by the issue of "hands in" productions. We all want quality outcomes to result from the work our students develop, but perhaps the question I have missed when thinking about animation projects in the classroom is why we were really doing them. What purpose will they serve? For me animation is about multimodal communication and storytelling, so maybe if this is what I want to achieve, then I should review this side of the process rather than dwelling on the technical aspects too much. Disney, Pixar and Aardman's animators, spend years honing their skills, and hours/months planning the outcomes and making the sets and environments in which they will set their stories. Perhaps their are other ways to develop situations where emergent learners can develop their understanding of the elements that make up the audio visual storytelling process. Ways that enable them to tell stories while they engage with and explore the nuances of the media and tools involved, and this is where the Common craft show came into my thinking.

I made some films with students in Y4 last year using the Stop Motion Process, and Stick Puppets to tell the story of the Ramayana. The project was split into scenes that we storyboarded in class and which the students went on to use in small groups to recount and tell different parts of the story as short stop motion clips. Their completed group video clips were later compiled as a class movie, by editing together on the IWB in Movie Maker. Communicating beyond the visual however was something the students found difficult to reconcile, and to support their story most drew on the familiar comic strip genre, including speech bubbles and captions to support their narrative. Because of our limited experiences at the time, time limitations for the projects and student eagerness to complete their work, the text elements were displayed for too short a time for their audience to see and appreciate them, but the idea was their. Animation as a storytelling process is incredibly complex, requiring more than the skills and knowledge of how to achieve motion, though in the emergent stages I think this is what the students find most exciting and appealing, the bringing to life of static and inanimate objects. While watching the Common Craft Show what struck me as powerful, was what might have happened if we had actually seen the video creation process as a digital writing outcome. Like "The Common Craft Show" this project used paper based hand drawn and screen printed cut outs. I have begun to ponder on how a "Common Craft" type approach, combining talk with the props we had developed as the "writing outcome" may have enabled text rehearsal and the bringing of these objects to life as a visual narrative.

A common craft type approach to using video and animation in the classroom seems to offer a powerful pedagogical tool, for linking some of the ideas I have explored in previous posts around multimodality and literacy development. Check out this description from The Commoncraft Blog where Lee describes

"How the workflow breaks down:

  • I create the first draft of the script and basic storyboard, we review it
  • We both edit the script, often concurrently using Google docs.
  • I create the illustrations
  • We walk through the storyboard and script together
  • In the studio, Sachi runs the camera and effects (animation/stop-action) and I direct the story
  • Sachi does all the video editing/finishing
  • I blog about it
In terms of our views of literacy and the writing process, what does this reveal about the complexities of digital text authoring. This reflects the complexities of a process based outcome, What Lies Beneath this situation, far outweighs the apparent simplicity of the outcome. Planning, drafting, , reworking/editing/revising, rehearsing, performing, evaluating, before re-editing, revision and publication; and throughout... Collaborating.

The process of oral storytelling, storyboarding and talk for writing we have begun to develop in support of "podcasting" seems very similar. Many of the materials the students develop to do this never see the light of day beyond the planning stage. Using this whiteboard based visual storytelling medium and process would I'm sure not only be really good fun but an interesting way to blend and evidence the role of talk for writing through practical activity and outcome. The added bonus is that using this medium as the writing outcome, we have courtesy of Common Craft a number of ready made models of the text form to draw on, share, evaluate and work with as a frame to hang the text development process on.

As a final soundbite, how about this project or one like it to link ideas from a science or geography project through ICT and an extended Literacy unit. How would you classify it? Is it a non chronological report, an explanatory or a Persuasive Text or does it encompass elements of all three?


How could we use this tool to enable students in taking ownership of and sharing their conceptual models or in bringing concept cartoons to life, perhaps using the process to explain pollination, photosynthesis or condensation? What about creating a set of instructions? Could we use the process to tell stories drawing on storyboards as writing media in their own right, with cut out characters and voice overs using digiblues. This would also be relatively easy to accomplish using digital cameras/ scanners and PhotoStory. How about using IWB presentations, capturing video through the smartboard recorder, with students adding narration through tools such as Movie Maker. The smartboard software could be installed for use as an application suite for this purpose on machines not attached to the whiteboard. This as you can tell has really got me thinking. What do you think?

16.3.08

Kiwi: by Dony Permedi

This fantastic animated short by Dony Permedi, in which a Kiwi seeks to fullfill his dream to fly, is a nondialogue based narrative that you might find useful as a starting point for talk for writing or for framing multimodal work. Doug Dickinson commenting on my posting of this clip through del.icio.us earlier this week recommends Kiwi as great for use within the Y 5 Unit 5 on Narrative.


Since I found this movie on You Tube, for anyone reading this post in school right now it is likely and unfortunate that you cannot see it. Here is a process that you can use to download this file in a format you can use locally on you computer.

To Download Kiwi

Follow this link to Kiwi on YouTube,
In the address bar of your browser, select, right click and copy the url.

Visit zamzar.com, this is a file conversion web site.
Click the download video tab
click in the "step 1 select files or url to convert, highlight and delete "http://", and then right click and paste the url for Kiwi, that you copied.
Click Drop Down Menu in box 2 to decide on the file format you would like, scroll to video and choose
.wmv for a format to play in MS media player
.mov for a Quick Time Movie
Click in Box 3 and enter your email address.
Press convert.

After Zamzar has done its thing you will be emailed a url from which you can download your converted version of the file.

This process should work in downloading any video from YouTube. However be aware that not all files on this site are considered suitable for use in schools and hence YouTubes inclusion in LA Firewall filter lists, as such e safety considerations must be applied to any decisions you make regarding the use of this process. My advice to colleagues in school would always be to review any material of this type that you wish to use in class, and to plan for and consider its roll as you would any other textual material.

Downloading, careful use and review of videos such as this in relation to purpose is key to success, as is the choice of any story or book based text. I have published a number of posts about how I have used video and images in class, but hope this one entitled Spot the Inference is useful in thinking about how you might use Kiwi.

13.3.08

Layering it on Thickly! Playing With Podium Multitracking

This week I downloaded, installed and had a little time to play with the Podium Upgrade and am loving it. The key difference between version 1 of Softease's Educational Podcast Tool and the upgrade is that it affords multitracking, and the ability to layer sound within the episodes being produced.

It would be an understatement to say little other than this has changed, though the simplicity of the tool has not altered. The principles and processes underpinning podcast development with the tool remain the same but the ability to add additional tracks to files being developed, adds an entirely different dimension to the possibilities for multimodal outcome creation. The addition of multitracking now enables a less linear approach to developing episodes than before, and is something I know at least one of my students has been waiting for. By adding a new track; background music or sound effects can be imported and added, and individual volume controls on each track used to alter their volume, enabling simple mixing and allowing the user to add depth to the "soundscape" they are recording.

The idea of "soundscape" development is a really exciting additional aspect of the upgrade for me, I can see possibilities for using this new version of Podium not only for podcasting but as a wider part of our digital authoring toolbox. Perhaps performing a role as a basic editing suite alongside Garageband, to create narration and backing for MovieMaker or PhotoStory projects. The addition of Multitracking makes Podium much more versatile, somewhere to create and produce sound tracks or "soundscapes"for use in other digital outcomes as well as its intended purpose, for example the narration for a video with background music. The object based nature of the soundtrack, means that not only can new sounds be imported, but they can also be dragged to the location desired by the user on a timeline, making them audio authors. Where perhaps previously the notion of, we added that sound because we could or because it was the only one we could find, this enables us to build on student experiences of Podcasting or evaluation of video texts to support consideration of the role sounds and music play in multimodal texts we engage with or are creating. I am really excited by the possibilities that this new version of Podium brings to the idea of "Playing With Sound," So now its time to have the upgrade installed and begin exploring the practicalities of my wandering mind!

3.3.08

Measurement and the Probot

In a recent post I was excited to report that the humble Probot moved 1cm for every unit input, and was keen to take advantage of this as soon as possible with my students during numeracy. Last week we were exploring scales and investigating the relationships between standard units of measure, and this seemed like too good an opportunity to miss.

Over the course of the week our key objective was to be able to read scales to the nearest half division, and since we are Y3 as the week progressed I wanted the students to engage practically with a range of scales. The context chosen was linear measure, where we began practicing our use and appropriate choice of tools and units, Using rulers and tape measures, to estimate and measure to the nearest whole and half division, while also considering the relationships between the units.
  • How many cm in a metre?
  • How many mm in a cm? And so on...
All of which would help us to create and solve the problems we would be working on with the Probot later in the week.

To work with the relationship between metres and cm, we carried out a group challenge to construct a skeleton of one member of each group. The students cut strips of sugar paper to represent two circumferences of the head, the length of the spine, each arm and each leg, the distance around the waist and three different measures around the chest, and across the shoulders. They estimated the length of each before using rulers to measure these in cm. Once the measuring tasks were completed the skeletons were assembled using a stapler. I mention this here because it was a task that really engaged the students, and which they really enjoyed.

On Friday we were ready to use the Probot. The session began with the students sitting around a large piece of card, a metre rule placed along its length, and the Probot bumper lined up with the start of the scale. The class were reminded of previous work they had done with BeeBots, and asked to identify the differences they could see between this tool and that.
  • It was a car not a bee
  • It had different buttons
  • It had forward and turn buttons, but it had a pad like a phone

The students were asked how they thought I would get it to move and a little time was spent as we discussed and established how we needed to press the direction buttons and then use numbers, rather than previous experiences of repeatedly pressing direction buttons to move the turtle.

The students were then asked to close their eyes, as I input fd 10, and then asked them on pressing go what they thought I had asked the Probot to do? We tested some of their suggestions, before confirming that I had pressed fd 10. What would happen then if I input fd 20, fd 30, could we predict where the Probot would stop. The students were asked to close their eyes again as I input fd 35 and pressed go. What had I input now? How did they know? Gradually we established that 1 Probot step was 1 cm.

Next a pen was put added to the Probot, and the class talked through the inputting of fd 10 rt 90 fd 20. Before the go button was pressed the students were asked to discuss and predict what they thought would happen. We then observed the trail left by the vehicle, and they were quick to recognise the right angle turn, enabling us to establish that this was the 90 (degree) input given with the right command, the 1/4 turn they were familiar with and had used with the BeeBot.

For the main activity the students were organised into groups. Each group was given a Probot, a collection precut paper strips of different lengths and some measuring tools to choose from. They were challenged to make mazes for each other, that included only right angle turns. Their friends were then to be challenged to use the things we had learned from our carpet time to input accurate instructions to navigate their Probot through the mazes. Throughout the task the students used measuring tools accurately and with purpose, discussed and planned routes applying mathematical vocabulary beginning to predict and using reasoning about the choices they were making. Above all however they really enjoyed themselves.

2.3.08

The Elonex One

Check out this post on Doug Dickinson's Blog about the Elonex One. Posted yesterday, I see it has already been edited and updated adding a sneak peak video demo from Ian Usher's Blog.

I liked the look of the Asus when revealed at the HHL conference in the Autumn, going so far as to have a live version of Linux burned to disc so I could play with the OS, feeling this was something I needed to explore and familiarise myself with. With this potential competitor, coming into the arena at sub £100, I will be fascinated to see how this all unfolds and to follow threads and thoughts around the 2 devices. I have a chance to look again at the Asus this week, but this time through the eyes of a local secondary school on Tuesday, as they share the device with parents and community as a potential element in their anytime anywhere learning solution. Can't wait!